
Compare Jyothy Labs with Similar Stocks
Total Returns (Price + Dividend) 
Latest dividend: 3.5 per share ex-dividend date: Aug-28-2025
Risk Adjusted Returns v/s
Returns Beta

News

Jyothy Labs Ltd. is Rated Sell by MarketsMOJO
Jyothy Labs Ltd. is rated 'Sell' by MarketsMOJO, with this rating last updated on 01 June 2026. However, the analysis and financial metrics discussed here reflect the stock's current position as of 19 June 2026, providing investors with an up-to-date view of the company’s fundamentals, returns, and market performance.
Read full news article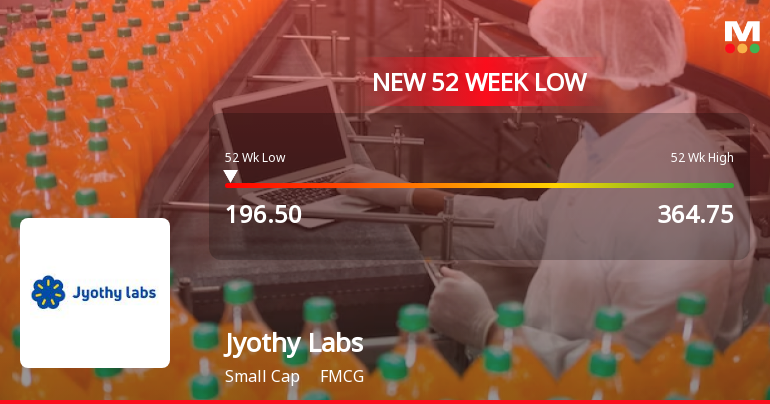
Jyothy Labs Ltd. Falls to 52-Week Low of Rs 196.5 as Sell-Off Deepens
A sharp decline has pushed Jyothy Labs Ltd. to a fresh 52-week low of Rs 196.5 on 8 Jun 2026, marking a significant 41.68% drop over the past year, far outpacing the broader Sensex's 10.43% decline during the same period.
Read full news article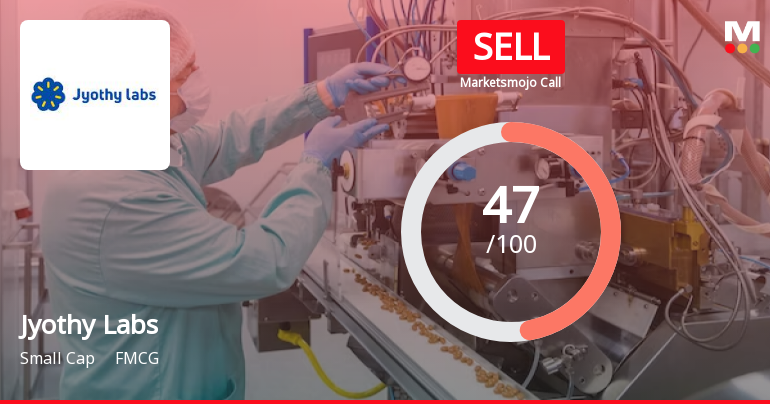
Jyothy Labs Ltd. is Rated Sell
Jyothy Labs Ltd. is rated Sell by MarketsMOJO, with this rating last updated on 01 June 2026. However, the analysis and financial metrics discussed here reflect the stock's current position as of 08 June 2026, providing investors with an up-to-date view of the company’s fundamentals, returns, and market performance.
Read full news article Announcements
Announcement under Regulation 30 (LODR)-Analyst / Investor Meet - Outcome
22-Jun-2026 | Source : BSEAnnouncement under Regulation 30 (LODR) - Investor Meet Outcome
Letter To Shareholders - Regulation 36(1)(B) Of The SEBI (Listing Obligations And Disclosure Requirements) Regulations 2015
20-Jun-2026 | Source : BSEPursuant to Regulation 36(1)(b) of the SEBI Listing Regulations a letter providing the web-link of the Annual Report 2025-26 has been dispatched to those shareholders whose email ids are not registered wIth Company / RTA.
Announcement under Regulation 30 (LODR)-Newspaper Publication
20-Jun-2026 | Source : BSENewspaper Advertisement - Notice convening 35th AGM and remote E-voting information
Corporate Actions

No Upcoming Board Meetings

Jyothy Labs Ltd. has declared 350% dividend, ex-date: 29 Jun 26

Jyothy Labs Ltd. has announced 1:5 stock split, ex-date: 12 Dec 08

Jyothy Labs Ltd. has announced 1:1 bonus issue, ex-date: 28 Jun 18

No Rights history available
Quality key factors
Valuation key factors
Technicals key factors
 Technical Indicator Scale: Bearish, Mildly Bearish, Sideways, Mildly Bullish, Bullish Turned
 Shareholding Snapshot : Mar 2026
Shareholding Compare (%holding)
Promoters
None
Held by 14 Schemes (13.15%)
Held by 134 FIIs (12.35%)
M. P. Ramachandran Family Trust Ii (trustees Being M. P. Ramachandran, M. R. Jyothy And M. R. Deepth (39.12%)
Nalanda India Equity Fund Limited (5.88%)
8.64%
Quarterly Results Snapshot (Standalone) - Mar'26 - YoY

YoY Growth in quarter ended Mar 2026 is 7.73% vs 1.02% in Mar 2025

YoY Growth in quarter ended Mar 2026 is -12.31% vs -1.53% in Mar 2025
Half Yearly Results Snapshot (Standalone) - Sep'25
Growth in half year ended Sep 2025 is 0.88% vs 3.97% in Sep 2024
Growth in half year ended Sep 2025 is -10.74% vs 2.97% in Sep 2024
Nine Monthly Results Snapshot (Standalone) - Dec'25
YoY Growth in nine months ended Dec 2025 is 2.25% vs 3.97% in Dec 2024
YoY Growth in nine months ended Dec 2025 is -9.69% vs 0.85% in Dec 2024
Annual Results Snapshot (Standalone) - Mar'26
YoY Growth in year ended Mar 2026 is 3.53% vs 3.26% in Mar 2025
YoY Growth in year ended Mar 2026 is -10.23% vs 0.35% in Mar 2025
About Jyothy Labs Ltd.

Company Coordinates


