
Compare Kay Power &Paper with Similar Stocks
Dashboard
High Debt company with Weak Long Term Fundamental Strength
- Poor long term growth as Net Sales has grown by an annual rate of 3.81% and Operating profit at 17.02% over the last 5 years
- High Debt Company with a Debt to Equity ratio (avg) of 8.22 times
- The company has been able to generate a Return on Capital Employed (avg) of 0.70% signifying low profitability per unit of total capital (equity and debt)
Flat results in Mar 26
Below par performance in long term as well as near term
Stock DNA
Paper, Forest & Jute Products
INR 34 Cr (Micro Cap)
34.00
17
0.00%
0.00
1.25%
0.43
Total Returns (Price + Dividend) 
Kay Power &Paper for the last several years.
Risk Adjusted Returns v/s
Returns Beta

News
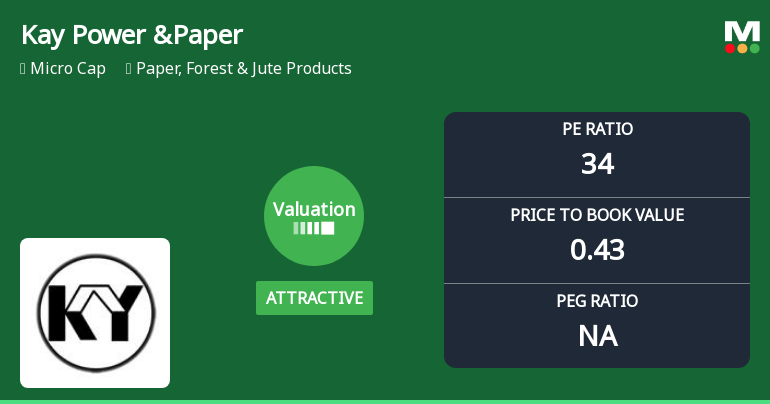
Kay Power & Paper Ltd Valuation Shifts Signal Renewed Price Attractiveness
Kay Power & Paper Ltd has recently undergone a notable shift in its valuation parameters, moving from a fair to an attractive rating despite ongoing challenges in profitability and returns. This micro-cap player in the Paper, Forest & Jute Products sector now presents a compelling case for investors seeking value, as its price-to-earnings (P/E) and price-to-book value (P/BV) ratios diverge favourably from historical and peer averages.
Read full news article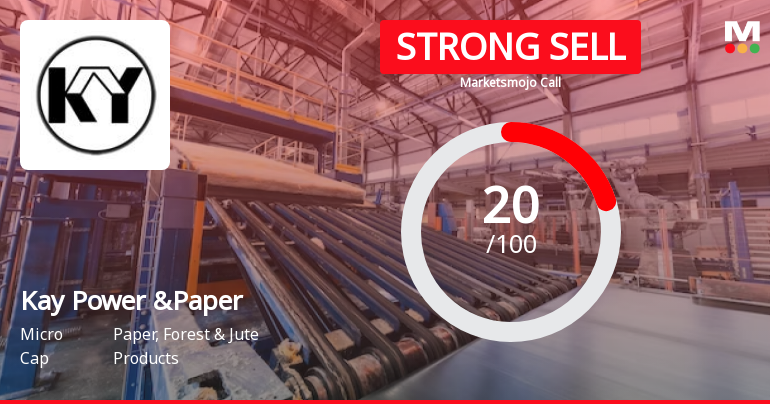
Kay Power & Paper Ltd is Rated Strong Sell
Kay Power & Paper Ltd is rated Strong Sell by MarketsMOJO, with this rating last updated on 16 Nov 2024. However, the analysis and financial metrics discussed here reflect the company’s current position as of 19 June 2026, providing investors with an up-to-date view of its fundamentals, valuation, financial trends, and technical outlook.
Read full news article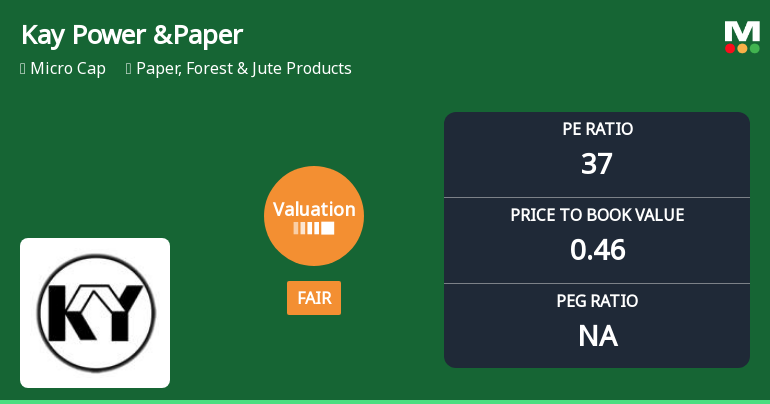
Kay Power & Paper Ltd Valuation Shifts to Fair Amid Mixed Market Performance
Kay Power & Paper Ltd, a micro-cap player in the Paper, Forest & Jute Products sector, has seen a notable shift in its valuation parameters, moving from an expensive to a fair valuation grade. Despite a challenging recent price performance, the stock’s long-term returns remain robust, prompting a detailed analysis of its price attractiveness relative to historical and peer benchmarks.
Read full news article Announcements
Closure of Trading Window
25-Jun-2026 | Source : BSEClosing of Trading Window
Announcement under Regulation 30 (LODR)-Resignation of Managing Director
02-Jun-2026 | Source : BSEIntimation of Resignation of Managing Director and director pursuant to regulation 30 of SEBI (LODR) Regulation 2015
Announcement under Regulation 30 (LODR)-Newspaper Publication
30-May-2026 | Source : BSEDisclosure of publication of Audited Financial results for the quarter and year ended 31.03.2026 under regulation 30 SEBI (LODR) Regulation 2015
Corporate Actions

No Upcoming Board Meetings

No Dividend history available

No Splits history available

No Bonus history available

No Rights history available
Quality key factors
Valuation key factors
Technicals key factors
 Technical Indicator Scale: Bearish, Mildly Bearish, Sideways, Mildly Bullish, Bullish Turned
 Shareholding Snapshot : Mar 2026
Shareholding Compare (%holding)
Promoters
None
Held by 0 Schemes
Held by 0 FIIs
Kay Nitroxygen Pvt Ltd (20.89%)
Bgp 11 Analytics Private Limited (4.58%)
38.59%
Quarterly Results Snapshot (Standalone) - Mar'26 - QoQ

QoQ Growth in quarter ended Mar 2026 is 2.95% vs -37.75% in Dec 2025
QoQ Growth in quarter ended Mar 2026 is 1,277.78% vs -550.00% in Dec 2025
Half Yearly Results Snapshot (Standalone) - Sep'25

Growth in half year ended Sep 2025 is -22.13% vs 20.11% in Sep 2024
Growth in half year ended Sep 2025 is -57.14% vs -76.67% in Sep 2024
Nine Monthly Results Snapshot (Standalone) - Dec'25
YoY Growth in nine months ended Dec 2025 is -31.06% vs 13.76% in Dec 2024
YoY Growth in nine months ended Dec 2025 is -137.50% vs -80.95% in Dec 2024
Annual Results Snapshot (Standalone) - Mar'26
YoY Growth in year ended Mar 2026 is -39.71% vs 12.08% in Mar 2025
YoY Growth in year ended Mar 2026 is -10.62% vs -24.67% in Mar 2025
About Kay Power & Paper Ltd

Company Coordinates


