
Compare Kay Power &Paper with Similar Stocks
Dashboard
High Debt company with Weak Long Term Fundamental Strength
- Poor long term growth as Net Sales has grown by an annual rate of 3.81% and Operating profit at 17.02% over the last 5 years
- High Debt Company with a Debt to Equity ratio (avg) of 8.22 times
- The company has been able to generate a Return on Capital Employed (avg) of 0.70% signifying low profitability per unit of total capital (equity and debt)
Flat results in Mar 26
Underperformed the market in the last 1 year
Stock DNA
Paper, Forest & Jute Products
INR 35 Cr (Micro Cap)
33.00
17
0.00%
0.00
1.25%
0.43
Total Returns (Price + Dividend) 
Kay Power &Paper for the last several years.
Risk Adjusted Returns v/s
Returns Beta

News

Kay Power & Paper Ltd Valuation Shifts to Fair Amid Mixed Market Performance
Kay Power & Paper Ltd, a micro-cap player in the Paper, Forest & Jute Products sector, has seen its valuation grade downgraded from attractive to fair amid rising price-to-earnings and price-to-book ratios. Despite a recent 10.00% intraday surge, the company’s fundamentals and relative valuation metrics suggest a cautious outlook for investors navigating this volatile segment.
Read full news article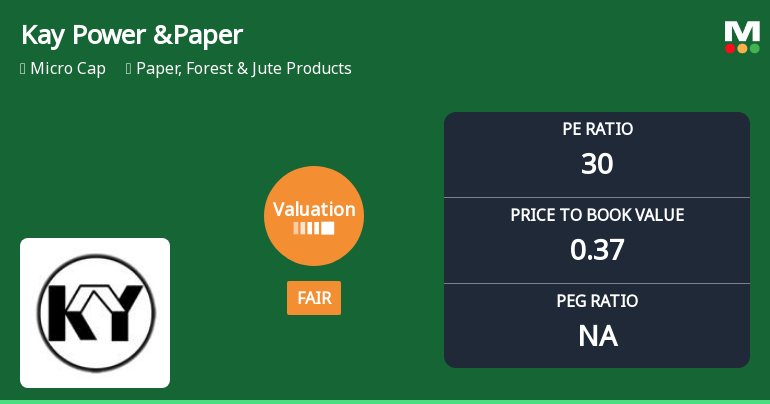
Kay Power & Paper Ltd Valuation Shifts to Fair Amidst Market Pressure
Kay Power & Paper Ltd, a micro-cap player in the Paper, Forest & Jute Products sector, has seen its valuation grade downgraded from attractive to fair, reflecting a notable shift in price attractiveness. Despite a strong historical return profile, recent market dynamics and valuation metrics suggest caution for investors as the company grapples with elevated price-to-earnings and subdued profitability ratios.
Read full news article
Kay Power & Paper Ltd is Rated Strong Sell
Kay Power & Paper Ltd is rated Strong Sell by MarketsMOJO, with this rating last updated on 16 Nov 2024. However, the analysis and financial metrics discussed here reflect the stock’s current position as of 03 July 2026, providing investors with an up-to-date perspective on the company’s fundamentals, valuation, financial trend, and technical outlook.
Read full news article Announcements
Intimation Under Regulation 30 Of The SEBI (LODR) Regulations 2015 - Incorporation Of A Wholly Owned Subsidiary Company.
16-Jul-2026 | Source : BSEPursuant to Regulation 30 of the SEBI (LODR) Regulation 2015 we hereby inform you that the company has incorporated a new wholly owned subsidiary by the name of Kay Pulp and Paper Mills Private Limited. The said subsidiary company was incorporated on 15.07.2026.
Compliances-Certificate under Reg. 74 (5) of SEBI (DP) Regulations 2018
07-Jul-2026 | Source : BSEPursuant to Regulation 74(5) of SEBI (Depositories and Participants) Regulation 2018 enclosed herewith a certificate dated 1st July 2026 received from MUFG Intime India Private Limited. the registrar and share transfer agent of the company for the first quarter ended 30th June 2026
Closure of Trading Window
25-Jun-2026 | Source : BSEClosing of Trading Window
Corporate Actions

No Upcoming Board Meetings

No Dividend history available

No Splits history available

No Bonus history available

No Rights history available
Quality key factors
Valuation key factors
Technicals key factors
 Technical Indicator Scale: Bearish, Mildly Bearish, Sideways, Mildly Bullish, Bullish Turned
 Shareholding Snapshot : Mar 2026
Shareholding Compare (%holding)
Promoters
None
Held by 0 Schemes
Held by 0 FIIs
Kay Nitroxygen Pvt Ltd (20.89%)
Bgp 11 Analytics Private Limited (4.58%)
38.59%
Quarterly Results Snapshot (Standalone) - Mar'26 - QoQ

QoQ Growth in quarter ended Mar 2026 is 2.95% vs -37.75% in Dec 2025
QoQ Growth in quarter ended Mar 2026 is 1,277.78% vs -550.00% in Dec 2025
Half Yearly Results Snapshot (Standalone) - Sep'25

Growth in half year ended Sep 2025 is -22.13% vs 20.11% in Sep 2024
Growth in half year ended Sep 2025 is -57.14% vs -76.67% in Sep 2024
Nine Monthly Results Snapshot (Standalone) - Dec'25
YoY Growth in nine months ended Dec 2025 is -31.06% vs 13.76% in Dec 2024
YoY Growth in nine months ended Dec 2025 is -137.50% vs -80.95% in Dec 2024
Annual Results Snapshot (Standalone) - Mar'26
YoY Growth in year ended Mar 2026 is -39.71% vs 12.08% in Mar 2025
YoY Growth in year ended Mar 2026 is -10.62% vs -24.67% in Mar 2025
About Kay Power & Paper Ltd

Company Coordinates


