Pakka

  • Market Cap: Micro Cap
  • Industry: Paper, Forest & Jute Products
  • ISIN: INE551D01018
  • NSEID: PAKKA
  • BSEID: 516030
INR
78.46
0.8 (1.03%)
BSENSE

Aug 28, 03:30 PM

BSE+NSE Vol: 1.02 lacs

  • Price Points
  • Score
  • Mojo Parameters
  • Total Return
  • News and Corporate Actions
  • Key factors
  • Shareholding
  • Financials
  • CompanyCV
stock-summaryPrice Point
High/Low

1Day

52 Week

Valuation
Technical
Day's Volume

CASH

1.02 lacs (-34.75%) Volume

Shareholding (Jun 2026)

FII

0.14%

Held by 4 FIIs

DII

12.18%

Held by 7 DIIs

Promoter

39.27%

Why is Pakka Ltd falling/rising?

29-Aug-2026

As of 28-Aug, Pakka Ltd's stock price is currently rising at 78.46, indicating a potential trend reversal after previous declines. However, the stock has seen significant long-term declines, and decreased delivery volume raises concerns about the sustainability of this short-term recovery.

As of 28-Aug, Pakka Ltd's stock price is rising, currently at 78.46, with a change of 0.8 (1.03%) upwards. This increase comes after two consecutive days of decline, indicating a potential trend reversal. The stock's performance today is described as inline with the sector, suggesting that it is not underperforming relative to its peers. <BR><BR>Despite the positive movement today, it is important to note that the stock has experienced significant declines over longer periods, including a year-to-date drop of 25.98% and a one-year decline of 47.09%. Additionally, the stock's delivery volume has decreased by 27.53% compared to the five-day average, indicating falling investor participation, which could be a concern for sustained price increases. <BR><BR>While the stock is currently above its 20-day and 50-day moving averages, it remains below its 5-day, 100-day, and 200-day moving averages, which may suggest that the recent rise could be temporary unless supported by increased investor interest and volume. Overall, the current rise in stock price appears to be a short-term recovery amidst a broader context of declining performance over the past year.

View full answer

Should I buy, sell or hold Pakka Ltd?

27-Aug-2026

Who are in the management team of Pakka?

14-Aug-2026

The management team of Pakka includes Ved Krishna (Vice Chairman), Jagdeep Hira (Managing Director), Pradeep Vasant Dhobale (Chairman & Independent Director), and several other directors and officers, bringing diverse expertise to the company.

The management team of Pakka includes the following individuals:<BR><BR>1. **Ved Krishna** - Vice Chairman<BR>2. **Manjula Jhunjhunwala** - Director<BR>3. **Kimberly Ann McArthur** - Director<BR>4. **Indroneel Banerjee** - Independent Director<BR>5. **Atul Kumar Gupta** - Independent Director<BR>6. **Jagdeep Hira** - Managing Director<BR>7. **Pradeep Vasant Dhobale** - Chairman & Independent Director<BR>8. **Basant Kumar Khaitan** - Independent Director<BR>9. **Bhavna Kodarbhai Patel** - Company Secretary & Compliance Officer<BR>10. **Himanshu Kapoor** - Additional Non-Executive Director<BR>11. **Gautam Ghosh** - Additional Director<BR><BR>This team brings a diverse range of expertise and leadership to the company.

View full answer

What does Pakka do?

14-Aug-2026

Pakka Ltd, a Micro Cap company in the Paper, Forest & Jute Products industry, reported net sales of 102 Cr and a net profit of 4 Cr for the quarter ending March 2026. Originally incorporated as Yash Papers Limited in 1981, it underwent name changes in 2019 and 2023.

Overview:<BR>Pakka Ltd operates in the Paper, Forest & Jute Products industry and is classified as a Micro Cap company.<BR><BR>History:<BR>Pakka Ltd was originally incorporated as Yash Papers Limited in May 1981. The company underwent a name change to 'Yash Pakka Limited' on November 9, 2019, and was renamed to 'Pakka Limited' on April 29, 2023. The most recent quarterly results reported net sales and net profit for the period ending March 2026.<BR><BR>Financial Snapshot:<BR>- Net Sales: 102 Cr (Quarterly Results - Mar 2026)<BR>- Net Profit: 4 Cr (Quarterly Results - Mar 2026)<BR>- Market Cap: INR 335 Cr (Micro Cap)<BR><BR>Key Metrics:<BR>- P/E: 54.00<BR>- Industry P/E: 16<BR>- Dividend Yield: 0.00%<BR>- Debt Equity: 0.61<BR>- Return on Equity: 1.47%<BR>- Price to Book: 0.76<BR><BR>Contact Details:<BR>Address: Flat No 202 3A/172, Azad nagar Kanpur Uttar Pradesh : 208002<BR>Tel: 05278-208900/01<BR>Email: cs@yashpapers.com<BR>Website: http://www.yashpakka.com

View full answer

Who are the peers of the Pakka?

14-Aug-2026

Pakka's peers include Emami Paper, Satia Industries, Shree Rama News, Ludlow Jute, Orient Paper, Ruchira Papers, Genus Paper & Bo, Sh. Ajit Pulp, and Star Paper Mills. In terms of management risk, Ruchira Papers and Pakka have excellent ratings, while Pakka's 1-year return is -57.40%, significantly lower than its peers.

Peers: The peers of Pakka are Emami Paper, Satia Industries, Shree Rama News., Ludlow Jute, Orient Paper, Ruchira Papers, Genus Paper & Bo, Sh. Ajit Pulp, and Star Paper Mills.<BR><BR>Quality Snapshot: Excellent management risk is observed at Ruchira Papers and Pakka, while Average management risk is found at Emami Paper, Satia Industries, and Orient Paper, and the rest. Below Average management risk is present at Shree Rama News., Ludlow Jute, Genus Paper & Bo, Sh. Ajit Pulp, and Star Paper Mills. In terms of Growth, Excellent growth is not observed, while Below Average growth is noted at Emami Paper, Satia Industries, Shree Rama News., Ludlow Jute, Orient Paper, Pakka, Ruchira Papers, Genus Paper & Bo, Sh. Ajit Pulp, and Star Paper Mills. Capital Structure ratings show Excellent at Ruchira Papers and Star Paper Mills, Good at Satia Industries, and Below Average at Emami Paper, Shree Rama News., Ludlow Jute, Orient Paper, Pakka, Genus Paper & Bo, Sh. Ajit Pulp.<BR><BR>Return Snapshot: The peer with the highest 1-year return is Sh. Ajit Pulp at 28.81%, while the lowest is Satia Industries at -23.87%. Pakka's own 1-year return is -57.40%, which is significantly lower than both. Additionally, the six-month return is negative for Satia Industries, Shree Rama News., Ludlow Jute, Orient Paper, Ruchira Papers, Genus Paper & Bo, and Star Paper Mills.

View full answer

How big is Pakka?

14-Aug-2026

As of 14th August, Pakka Ltd has a market capitalization of 352.98 Cr, with recent Net Sales of 347.03 Cr and a Net Profit of 6.63 Cr. Shareholder's Funds are 452.06 Cr and Total Assets amount to 738.44 Cr as of March 2025.

As of 14th August, Pakka Ltd has a market capitalization of 352.98 Cr, categorizing it as a Micro Cap company.<BR><BR>In the latest four quarters, Pakka Ltd reported Net Sales of 347.03 Cr and a Net Profit of 6.63 Cr.<BR><BR>The latest annual period for the balance sheet is March 2025, with Shareholder's Funds amounting to 452.06 Cr and Total Assets of 738.44 Cr.

View full answer

Are Pakka Ltd latest results good or bad?

31-Jan-2026

Pakka Ltd's latest results are generally viewed as negative, showing a net profit of ₹7.08 crores in Q3 FY26, which is 20.36% lower than last year, despite a sequential revenue increase. The company faces significant challenges, including a 90.70% drop in cumulative profits for the year and a 64.63% decline in stock price over the past year.

Pakka Ltd's latest results present a mixed picture, leaning towards the negative side overall. While the company reported a net profit of ₹7.08 crores in Q3 FY26, marking a significant recovery from losses in the previous quarters, this profit is still 20.36% lower than the ₹8.89 crores earned in the same quarter last year. Additionally, the revenue of ₹96.58 crores shows a sequential improvement of 26.55% from the previous quarter but is down 8.90% year-on-year.<BR><BR>The operating margin improved dramatically to 14.44%, up from just 2.25% in the previous quarter, indicating enhanced operational efficiency. However, the nine-month performance reveals a staggering 90.70% drop in cumulative profits compared to the previous year, raising concerns about the sustainability of this recovery.<BR><BR>Investor sentiment appears deeply negative, as evidenced by the stock's 64.63% decline over the past year and its current trading price of ₹93.05, which is significantly below major moving averages. The company is also facing challenges with capital efficiency, as indicated by a return on equity (ROE) of just 1.87%, down from a five-year average of 12.43%.<BR><BR>In summary, while there are signs of recovery in the latest quarter, the overall financial performance and market sentiment suggest that the results are viewed as more bad than good, with significant challenges ahead for Pakka Ltd.

View full answer

Is Pakka overvalued or undervalued?

18-Nov-2025

As of November 17, 2025, Pakka is considered overvalued with a PE Ratio of 62.84 and an EV to EBIT of 54.62, significantly higher than peers like JK Paper and West Coast Paper, and has underperformed the Sensex with a 62.18% decline year-to-date.

As of 17 November 2025, the valuation grade for Pakka has moved from very attractive to attractive, indicating a shift in market perception. The company is currently assessed as overvalued. Key ratios reflect this assessment, with a PE Ratio of 62.84, an EV to EBIT of 54.62, and a ROCE of only 2.17%. <BR><BR>When compared to peers, Pakka's valuation stands out significantly; for instance, JK Paper has a PE Ratio of 21.56 and an EV to EBITDA of 9.21, while West Coast Paper is valued at a PE of 15.66 and an EV to EBITDA of 5.66. These comparisons highlight that Pakka's valuation metrics are substantially higher than those of its peers, reinforcing the conclusion of overvaluation. Additionally, Pakka's stock has underperformed relative to the Sensex, particularly in the year-to-date period, where it has declined by 62.18% compared to the Sensex's gain of 8.72%.

View full answer

How has been the historical performance of Pakka?

09-Nov-2025

Pakka's historical performance shows fluctuating net sales, stable operating income around 400 Cr, but rising total expenditure has led to decreased operating profit and profit after tax over the past four years. Despite growth in total assets, profitability has faced challenges.

Answer:<BR>The historical performance of Pakka shows a fluctuating trend in key financial metrics over the past four years.<BR><BR>Breakdown:<BR>Pakka's net sales have shown slight fluctuations, with figures of 406.04 Cr in Mar'25, 404.74 Cr in Mar'24, and 408.31 Cr in Mar'23, up from 291.09 Cr in Mar'22. The total operating income mirrored this trend, remaining stable around the 400 Cr mark in recent years. However, total expenditure has increased significantly from 228.40 Cr in Mar'22 to 346.32 Cr in Mar'25. This rise in costs has impacted operating profit, which decreased from 90.46 Cr in Mar'24 to 74.41 Cr in Mar'25, despite a steady gross profit margin of around 15-20%. Profit before tax also declined from 67.37 Cr in Mar'24 to 47.97 Cr in Mar'25, leading to a profit after tax of 37.52 Cr in Mar'25, down from 43.40 Cr in Mar'24. The company's total assets have increased from 324.50 Cr in Mar'22 to 738.44 Cr in Mar'25, while total liabilities rose from 204.44 Cr to 204.44 Cr over the same period. Cash flow from operating activities has decreased significantly to 11.00 Cr in Mar'25 from 43.00 Cr in Mar'24, although net cash inflow remained positive at 11.00 Cr in Mar'25. Overall, while Pakka has experienced growth in sales and assets, profitability has faced challenges in recent years.

View full answer

When is the next results date for Pakka?

04-Nov-2025

The next results date for Pakka is 08 November 2025.

The next results date for Pakka is scheduled for 08 November 2025.

View full answer

Is Pakka technically bullish or bearish?

06-Oct-2025

As of October 3, 2025, the technical trend for Pakka is bearish with moderate strength, driven by bearish MACD readings, moving averages, and KST across multiple time frames, despite some bullish divergence in the RSI on the monthly chart.

As of 3 October 2025, the technical trend has changed from mildly bearish to bearish. The current technical stance for Pakka is bearish with moderate strength. Key indicators driving this stance include bearish MACD readings on both the weekly and monthly time frames, bearish moving averages on the daily chart, and bearish KST on both weekly and monthly. The RSI shows no signal on the weekly but is bullish on the monthly, indicating some divergence. Additionally, Bollinger Bands are mildly bearish on both weekly and monthly charts, while the Dow Theory is mildly bearish on the weekly. Overall, the bearish indicators outweigh the bullish signals, reinforcing the bearish outlook.

View full answer

Who are the top shareholders of the Pakka?

17-Jul-2025

The top shareholders of Pakka include Ved Krishna with a 30.8% stake, individual investors with 39.79%, and SBI Long Term Advantage Fund - Series VI as the largest institutional shareholder at 8.01%. Additionally, there are two mutual fund schemes with a combined 8.01% and 17 foreign institutional investors holding 0.49%.

The top shareholders of Pakka include Ved Krishna, who holds the highest promoter stake at 30.8%. Additionally, individual investors collectively own 39.79% of the company. Among institutional investors, the SBI Long Term Advantage Fund - Series VI is the largest public shareholder with an 8.01% stake. The company also has 2 mutual fund schemes holding a combined 8.01%, and 17 foreign institutional investors (FIIs) with a total holding of 0.49%. There is also a pledged promoter holding of 9.1014%.

View full answer

Has Pakka declared dividend?

06-Jun-2025

Yes, Pakka Ltd has declared a 24% dividend, amounting to 2.4 per share, with an ex-date of September 22, 2023. While recent returns have been negative, the company has shown substantial gains over longer periods, particularly a total return of 429.42% over the last five years.

Pakka Ltd has declared a 24% dividend.<BR><BR>Dividend Details:<BR>- Percentage announced: 24%<BR>- Amount per share: 2.4<BR>- Ex-date: 22 Sep 23<BR><BR>Dividend Yield: 0%<BR><BR>Total Returns by Period:<BR>In the last 6 months, Pakka Ltd experienced a price return of -42.93%, with no dividend return, resulting in a total return of -42.93%.<BR><BR>Over the past year, the price return was -24.05%, with no dividend return, leading to a total return of -24.05%.<BR><BR>In the 2-year period, the price return was 56.79%, with a dividend return of 2.11%, culminating in a total return of 58.9%.<BR><BR>For the 3-year period, the price return stood at 131.48%, with a dividend return of 6.21%, resulting in a total return of 137.69%.<BR><BR>In the 4-year period, the price return was 99.06%, with a dividend return of 6.19%, giving a total return of 105.25%.<BR><BR>Finally, in the 5-year period, the price return reached 409.39%, with a dividend return of 20.03%, leading to a total return of 429.42%.<BR><BR>Overall, while Pakka Ltd has declared a dividend, the recent total returns indicate significant volatility, particularly in the short term, with negative returns over the last year and six months. However, the longer-term performance shows substantial gains, particularly over the 5-year period.

View full answer
iScoreScore
Click here to find our call on this stock
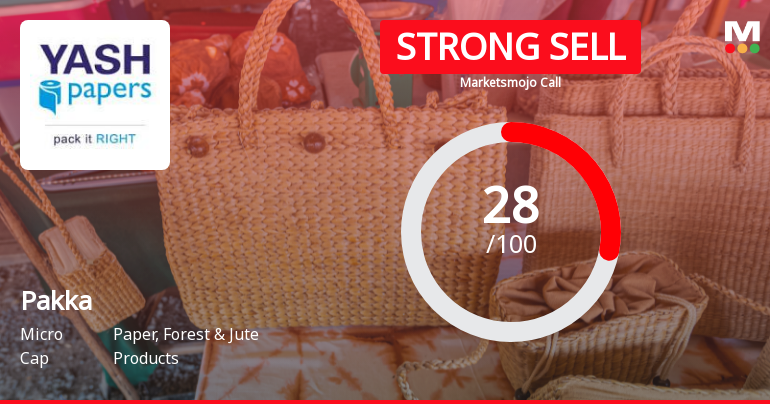
Strong Sell
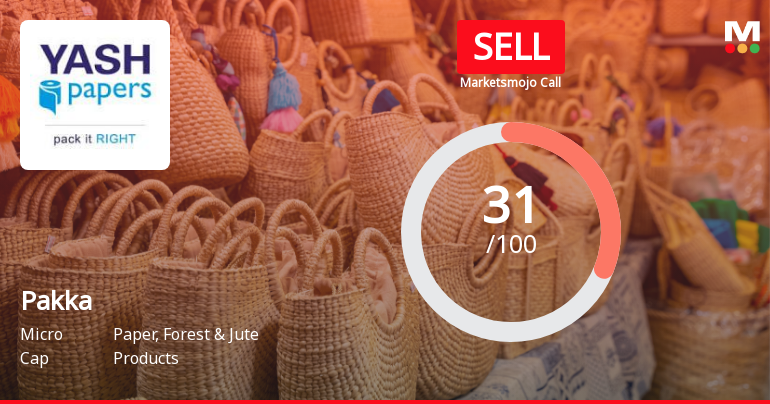
Sell
Hold
Buy
Strong Buy

Dashboard

1

Weak Long Term Fundamental Strength with a -31.37% CAGR growth in Operating Profits over the last 5 years

 
2

Flat results in Jun 26

3

76.68% of Promoter Shares are Pledged

4

Below par performance in long term as well as near term

stock-summaryMojo Parameters

Mojo Parameters

Loading Valuation Snapshot...

Stock DNA

stock-summary
Industry

Paper, Forest & Jute Products

stock-summary
Market cap

INR 374 Cr (Micro Cap)

stock-summary
P/E

27.00

stock-summary
Industry P/E

15

stock-summary
Dividend Yield

0.00%

stock-summary
Debt Equity

0.61

stock-summary
Return on Equity

1.45%

stock-summary
Price to Book

0.82

Revenue and Profits:
Net Sales:
117 Cr
(Quarterly Results - Jun 2026)
Net Profit:
6 Cr
stock-summaryTotal Returns
Total Returns (Price + Dividend) stock-summary
Dividend Yield (0%)
TimePeriod
Price Return
Dividend Return
Total Return
3 Months
-13.93%
0%
-13.93%
6 Months
-12.54%
0%
-12.54%
1 Year
-47.09%
0%
-47.09%
2 Years
-75.7%
0%
-75.7%
3 Years
-57.37%
1.15%
-56.22%
4 Years
-23.04%
3.74%
-19.3%
5 Years
-9.97%
5.32%
-4.65%

Latest dividend: 2.4 per share ex-dividend date: Sep-22-2023

Risk Adjusted Returns v/s stock-summary
Returns Beta
Icon
Beta has not been calculated since enough price history is not available
stock-summaryNews & Corporate Actions

News

Pakka Ltd Falls 7.41%: 3 Key Factors Driving the Weekly Decline

Announcements stock-summary

Announcement under Regulation 30 (LODR)-Analyst / Investor Meet - Outcome

25-Aug-2026 | Source : BSE

Dear Sir / Madam

Disclosures under Reg. 29(2) of SEBI (SAST) Regulations 2011

21-Aug-2026 | Source : BSE

The Exchange has received the disclosure under Regulation 29(2) of SEBI (Substantial Acquisition of Shares & Takeovers) Regulations 2011 for SBI Mutual Fund

Announcement under Regulation 30 (LODR)-Analyst / Investor Meet - Outcome

18-Aug-2026 | Source : BSE

Dear Sir/Madam

Corporate Actions stock-summary

stock-summary
BOARD MEETING

No Upcoming Board Meetings

stock-summary
DIVIDEND

Pakka Ltd has declared 24% dividend, ex-date: 22 Sep 23

stock-summary
SPLITS

No Splits history available

stock-summary
BONUS

No Bonus history available

stock-summary
RIGHTS

No Rights history available

stock-summaryKey Factors

Quality key factors stock-summary

Factor
Value
Sales Growth (5y)
-2.89%
EBIT Growth (5y)
-31.37%
EBIT to Interest (avg)
4.45
Debt to EBITDA (avg)
3.01
Net Debt to Equity (avg)
0.61
Sales to Capital Employed (avg)
0.92
Tax Ratio
36.10%
Dividend Payout Ratio
0
Pledged Shares
76.68%
Institutional Holding
12.32%
ROCE (avg)
16.62%
ROE (avg)
12.35%

Valuation key factors

Factor
Value
P/E Ratio
27
Industry P/E
15
Price to Book Value
0.83
EV to EBIT
27.65
EV to EBITDA
16.13
EV to Capital Employed
0.89
EV to Sales
1.65
PEG Ratio
NA
Dividend Yield
NA
ROCE (Latest)
1.95%
ROE (Latest)
1.45%

Technicals key factors

Indicator
Weekly
Monthly
MACD
Mildly Bullish
Bearish
RSI
No Signal
No Signal
Bollinger Bands
Bearish
Mildly Bearish
Moving Averages
Mildly Bearish (Daily)
KST
Bearish
Bearish
Dow Theory
No Trend
Mildly Bearish
OBV
No Trend
Bullish
stock-summary Technical Indicator Scale: Bearish, Mildly Bearish, Sideways, Mildly Bullish, Bullish  Turned 
stock-summaryShareholding
Shareholding Snapshot : Jun 2026stock-summary
Shareholding Compare (%holding) stock-summary
Majority shareholders

Non Institution

Pledged Promoter Holdings

76.6842

Mutual Funds

Held by 2 Schemes (6.47%)

FIIs

Held by 4 FIIs (0.14%)

Promoter with highest holding

Ved Krishna (29.04%)

Highest Public shareholder

Sbi Magnum Children's Benefit Fund-investment Fund (6.47%)

Individual Investors Holdings

40.82%

stock-summaryFinancial
[
  {
    "link": "quarterly",
    "btn_text": "All Quarterly Results",
    "header": "Quarterly Results Snapshot (Consolidated) - Jun'26 - QoQ",
    "rhs": [
      {
        "prefix": "Net Sales ",
        "suffix": "QoQ Growth in quarter ended Jun 2026 is 15.54% vs 5.02% in Mar 2026",
        "dir": 1
      },
      {
        "prefix": "Consolidated Net Profit ",
        "suffix": "QoQ Growth in quarter ended Jun 2026 is 91.86% vs -56.64% in Mar 2026",
        "dir": 1
      }
    ],
    "table": {
      "header": [
        "Jun'26",
        "Mar'26",
        "Change(%)"
      ],
      "body": [
        {
          "field": "Net Sales",
          "val1": "117.19",
          "val2": "101.43",
          "chgp": "15.54%",
          "chgp_class": "positive"
        },
        {
          "field": "Operating Profit (PBDIT) excl Other Income",
          "val1": "15.30",
          "val2": "9.07",
          "chgp": "68.69%",
          "chgp_class": "positive"
        },
        {
          "field": "Interest",
          "val1": "4.87",
          "val2": "3.85",
          "chgp": "26.49%",
          "chgp_class": "negative"
        },
        {
          "field": "Exceptional Items",
          "val1": "0.00",
          "val2": "0.00",
          "chgp": "",
          "chgp_class": "neutral"
        },
        {
          "field": "Consolidate Net Profit",
          "val1": "5.89",
          "val2": "3.07",
          "chgp": "91.86%",
          "chgp_class": "positive"
        },
        {
          "field": "Operating Profit Margin (Excl OI)",
          "val1": "13.06%",
          "val2": "8.94%",
          "chgp": "4.12%",
          "chgp_class": "positive"
        }
      ]
    }
  },
  {
    "link": "half-yearly",
    "btn_text": "All Half Yearly Results",
    "header": "Half Yearly Results Snapshot (Consolidated) - Sep'25",
    "rhs": [
      {
        "prefix": "Net Sales ",
        "suffix": " Growth in half year ended Sep 2025 is -23.86% vs -1.40% in Sep 2024",
        "dir": -1
      },
      {
        "prefix": "Consolidated Net Profit ",
        "suffix": " Growth in half year ended Sep 2025 is -114.31% vs 0.12% in Sep 2024",
        "dir": -1
      }
    ],
    "table": {
      "header": [
        "Sep'25",
        "Sep'24",
        "Change(%)"
      ],
      "body": [
        {
          "field": "Net Sales",
          "val1": "158.29",
          "val2": "207.88",
          "chgp": "-23.86%",
          "chgp_class": "negative"
        },
        {
          "field": "Operating Profit (PBDIT) excl Other Income",
          "val1": "7.65",
          "val2": "38.83",
          "chgp": "-80.30%",
          "chgp_class": "negative"
        },
        {
          "field": "Interest",
          "val1": "5.63",
          "val2": "5.69",
          "chgp": "-1.05%",
          "chgp_class": "positive"
        },
        {
          "field": "Exceptional Items",
          "val1": "0.00",
          "val2": "0.00",
          "chgp": "",
          "chgp_class": "neutral"
        },
        {
          "field": "Consolidate Net Profit",
          "val1": "-3.64",
          "val2": "25.44",
          "chgp": "-114.31%",
          "chgp_class": "negative"
        },
        {
          "field": "Operating Profit Margin (Excl OI)",
          "val1": "4.83%",
          "val2": "18.68%",
          "chgp": "-13.85%",
          "chgp_class": "negative"
        }
      ]
    }
  },
  {
    "link": "nine-monthly",
    "btn_text": "All Nine Monthly Results",
    "header": "Nine Monthly Results Snapshot (Consolidated) - Dec'25",
    "rhs": [
      {
        "prefix": "Net Sales ",
        "suffix": "YoY Growth in nine months ended Dec 2025 is -18.80% vs 1.20% in Dec 2024",
        "dir": -1
      },
      {
        "prefix": "Consolidated Net Profit ",
        "suffix": "YoY Growth in nine months ended Dec 2025 is -89.98% vs -2.80% in Dec 2024",
        "dir": -1
      }
    ],
    "table": {
      "header": [
        "Dec'25",
        "Dec'24",
        "Change(%)"
      ],
      "body": [
        {
          "field": "Net Sales",
          "val1": "254.87",
          "val2": "313.89",
          "chgp": "-18.80%",
          "chgp_class": "negative"
        },
        {
          "field": "Operating Profit (PBDIT) excl Other Income",
          "val1": "21.60",
          "val2": "53.99",
          "chgp": "-59.99%",
          "chgp_class": "negative"
        },
        {
          "field": "Interest",
          "val1": "7.92",
          "val2": "7.80",
          "chgp": "1.54%",
          "chgp_class": "negative"
        },
        {
          "field": "Exceptional Items",
          "val1": "0.00",
          "val2": "0.00",
          "chgp": "",
          "chgp_class": "neutral"
        },
        {
          "field": "Consolidate Net Profit",
          "val1": "3.44",
          "val2": "34.33",
          "chgp": "-89.98%",
          "chgp_class": "negative"
        },
        {
          "field": "Operating Profit Margin (Excl OI)",
          "val1": "8.47%",
          "val2": "17.20%",
          "chgp": "-8.73%",
          "chgp_class": "negative"
        }
      ]
    }
  },
  {
    "link": "annual",
    "btn_text": "All Annual Results",
    "header": "Annual Results Snapshot (Consolidated) - Mar'26",
    "rhs": [
      {
        "prefix": "Net Sales ",
        "suffix": "YoY Growth in year ended Mar 2026 is -12.25% vs 0.32% in Mar 2025",
        "dir": -1
      },
      {
        "prefix": "Consolidated Net Profit ",
        "suffix": "YoY Growth in year ended Mar 2026 is -82.68% vs -13.55% in Mar 2025",
        "dir": -1
      }
    ],
    "table": {
      "header": [
        "Mar'26",
        "Mar'25",
        "Change(%)"
      ],
      "body": [
        {
          "field": "Net Sales",
          "val1": "356.29",
          "val2": "406.04",
          "chgp": "-12.25%",
          "chgp_class": "negative"
        },
        {
          "field": "Operating Profit (PBDIT) excl Other Income",
          "val1": "30.66",
          "val2": "59.72",
          "chgp": "-48.66%",
          "chgp_class": "negative"
        },
        {
          "field": "Interest",
          "val1": "11.77",
          "val2": "10.49",
          "chgp": "12.20%",
          "chgp_class": "negative"
        },
        {
          "field": "Exceptional Items",
          "val1": "0.00",
          "val2": "0.00",
          "chgp": "",
          "chgp_class": "neutral"
        },
        {
          "field": "Consolidate Net Profit",
          "val1": "6.50",
          "val2": "37.52",
          "chgp": "-82.68%",
          "chgp_class": "negative"
        },
        {
          "field": "Operating Profit Margin (Excl OI)",
          "val1": "8.61%",
          "val2": "14.71%",
          "chgp": "-6.10%",
          "chgp_class": "negative"
        }
      ]
    }
  }
]

Quarterly Results Snapshot (Consolidated) - Jun'26 - QoQstock-summary

Jun'26
Mar'26
Change(%)
Net Sales
117.19
101.43
15.54%
Operating Profit (PBDIT) excl Other Income
15.30
9.07
68.69%
Interest
4.87
3.85
26.49%
Exceptional Items
0.00
0.00
Consolidate Net Profit
5.89
3.07
91.86%
Operating Profit Margin (Excl OI)
13.06%
8.94%
4.12%
Values in Rs Cr.
Direction Arrows
Net Sales

QoQ Growth in quarter ended Jun 2026 is 15.54% vs 5.02% in Mar 2026

Direction Arrows
Consolidated Net Profit

QoQ Growth in quarter ended Jun 2026 is 91.86% vs -56.64% in Mar 2026

Half Yearly Results Snapshot (Consolidated) - Sep'25stock-summary

Sep'25
Sep'24
Change(%)
Net Sales
158.29
207.88
-23.86%
Operating Profit (PBDIT) excl Other Income
7.65
38.83
-80.30%
Interest
5.63
5.69
-1.05%
Exceptional Items
0.00
0.00
Consolidate Net Profit
-3.64
25.44
-114.31%
Operating Profit Margin (Excl OI)
4.83%
18.68%
-13.85%
Values in Rs Cr.
Direction Arrows
Net Sales

Growth in half year ended Sep 2025 is -23.86% vs -1.40% in Sep 2024

Direction Arrows
Consolidated Net Profit

Growth in half year ended Sep 2025 is -114.31% vs 0.12% in Sep 2024

Nine Monthly Results Snapshot (Consolidated) - Dec'25stock-summary

Dec'25
Dec'24
Change(%)
Net Sales
254.87
313.89
-18.80%
Operating Profit (PBDIT) excl Other Income
21.60
53.99
-59.99%
Interest
7.92
7.80
1.54%
Exceptional Items
0.00
0.00
Consolidate Net Profit
3.44
34.33
-89.98%
Operating Profit Margin (Excl OI)
8.47%
17.20%
-8.73%
Values in Rs Cr.
Direction Arrows
Net Sales

YoY Growth in nine months ended Dec 2025 is -18.80% vs 1.20% in Dec 2024

Direction Arrows
Consolidated Net Profit

YoY Growth in nine months ended Dec 2025 is -89.98% vs -2.80% in Dec 2024

Annual Results Snapshot (Consolidated) - Mar'26stock-summary

Mar'26
Mar'25
Change(%)
Net Sales
356.29
406.04
-12.25%
Operating Profit (PBDIT) excl Other Income
30.66
59.72
-48.66%
Interest
11.77
10.49
12.20%
Exceptional Items
0.00
0.00
Consolidate Net Profit
6.50
37.52
-82.68%
Operating Profit Margin (Excl OI)
8.61%
14.71%
-6.10%
Values in Rs Cr.
Direction Arrows
Net Sales

YoY Growth in year ended Mar 2026 is -12.25% vs 0.32% in Mar 2025

Direction Arrows
Consolidated Net Profit

YoY Growth in year ended Mar 2026 is -82.68% vs -13.55% in Mar 2025

stock-summaryCompany CV
About Pakka Ltd stock-summary
stock-summary
Pakka Ltd
Micro Cap
Paper, Forest & Jute Products
Pakka Limited was formerly incorporated as Yash Papers Limited in May, 1981. The Company was renamed to 'Yash Pakka Limited' on November 9, 2019 and again to 'Pakka Limited' on April 29, 2023.
Company Coordinates stock-summary
Company Details
Flat No 202 3A/172, Azad nagar Kanpur Uttar Pradesh : 208002
stock-summary
Tel: 05278-208900/01
stock-summary
cs@yashpapers.com
Registrar Details
Skyline Financial Services Pvt Ltd , D-153/A, 1st Floor, Okhla Industrial Area, Phase - I, New Delhi