
Compare Pakka with Similar Stocks
Dashboard
Low ability to service debt as the company has a high Debt to EBITDA ratio of 10.88 times
- Low ability to service debt as the company has a high Debt to EBITDA ratio of 10.88 times
Poor long term growth as Net Sales has grown by an annual rate of 14.14% and Operating profit at 2.58% over the last 5 years
The company has declared Negative results for the last 4 consecutive quarters
76.68% of Promoter Shares are Pledged
Below par performance in long term as well as near term
Stock DNA
Paper, Forest & Jute Products
INR 390 Cr (Micro Cap)
58.00
17
0.00%
0.61
1.47%
0.87
Total Returns (Price + Dividend) 
Latest dividend: 2.3848563968668404 per share ex-dividend date: Sep-22-2023
Risk Adjusted Returns v/s
Returns Beta

News
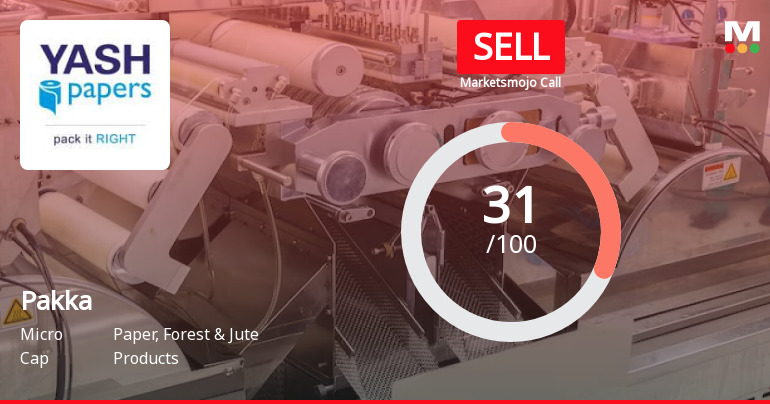
Pakka Ltd is Rated Sell by MarketsMOJO
Pakka Ltd is rated 'Sell' by MarketsMOJO, with this rating last updated on 04 June 2026. However, the analysis and financial metrics discussed here reflect the stock's current position as of 10 June 2026, providing investors with the latest insights into the company’s performance and outlook.
Read full news article
Pakka Ltd is Rated Strong Sell
Pakka Ltd is rated Strong Sell by MarketsMOJO, with this rating last updated on 06 Oct 2025. However, the analysis and financial metrics discussed here reflect the stock’s current position as of 26 May 2026, providing investors with an up-to-date view of the company’s performance and outlook.
Read full news article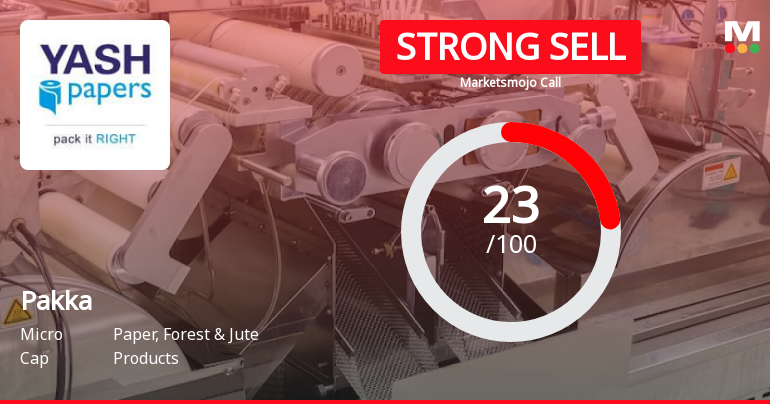
Pakka Ltd is Rated Strong Sell
Pakka Ltd is rated Strong Sell by MarketsMOJO, with this rating last updated on 06 Oct 2025. However, the analysis and financial metrics discussed here reflect the stock’s current position as of 15 May 2026, providing investors with an up-to-date view of the company’s performance and outlook.
Read full news article Announcements
Announcement under Regulation 30 (LODR)-Resignation of Chief Financial Officer (CFO)
16-Jun-2026 | Source : BSEKindly find attached herewith Disclosure for Resignation of Mrs. Neetika Suryawanshi Chief Financial Officer of the Company w.e.f. closure of business hours on 30th June 2026.
Announcement under Regulation 30 (LODR)-Credit Rating
10-Jun-2026 | Source : BSEDisclosure for Revision in Credit Rating by Care Ratings Limited.
Announcement under Regulation 30 (LODR)-Analyst / Investor Meet - Outcome
10-Jun-2026 | Source : BSEDear Sir / Madam Pursuant to Regulation 30 of the SEBI (Listing Obligations and Disclosure Requirements) Regulations 2015 read with Part A of Schedule III thereof we hereby submit the transcript of the Investors Conference Call held on Tuesday 2nd June 2026 at 04:00 p.m. (IST) wherein the management discussed the financial performance of the Company for the fourth quarter and financial year ended 31st March 2026. In compliance with the aforesaid Regulations the transcript of the said conference call has also been made available on the website of the Company at https://pakka.com/. We request you to kindly take the above information on record.
Corporate Actions

No Upcoming Board Meetings

Pakka Ltd has declared 24% dividend, ex-date: 22 Sep 23

No Splits history available

No Bonus history available

No Rights history available
Quality key factors
Valuation key factors
Technicals key factors
 Technical Indicator Scale: Bearish, Mildly Bearish, Sideways, Mildly Bullish, Bullish Turned
 Shareholding Snapshot : Jun 2026
Shareholding Compare (%holding)
Non Institution
76.6842
Held by 2 Schemes (6.86%)
Held by 4 FIIs (0.15%)
Ved Krishna (30.8%)
Sbi Magnum Children's Benefit Fund-investment Fund (6.86%)
43.29%
Quarterly Results Snapshot (Standalone) - Mar'26 - QoQ

QoQ Growth in quarter ended Mar 2026 is 5.56% vs 26.87% in Dec 2025
QoQ Growth in quarter ended Mar 2026 is -57.99% vs 2,946.67% in Dec 2025
Half Yearly Results Snapshot (Consolidated) - Sep'25
Growth in half year ended Sep 2025 is -23.86% vs -1.40% in Sep 2024
Growth in half year ended Sep 2025 is -114.31% vs 0.12% in Sep 2024
Nine Monthly Results Snapshot (Consolidated) - Dec'25
YoY Growth in nine months ended Dec 2025 is -18.80% vs 1.20% in Dec 2024
YoY Growth in nine months ended Dec 2025 is -89.98% vs -2.80% in Dec 2024
Annual Results Snapshot (Standalone) - Mar'26
YoY Growth in year ended Mar 2026 is -12.37% vs 0.32% in Mar 2025
YoY Growth in year ended Mar 2026 is -67.99% vs 16.50% in Mar 2025
About Pakka Ltd

Company Coordinates


