
Compare Gujarat Intrux with Similar Stocks
Stock DNA
Castings & Forgings
INR 149 Cr (Micro Cap)
14.00
26
5.23%
-0.07
15.66%
2.24
Total Returns (Price + Dividend) 
Latest dividend: 7.5085227272727275 per share ex-dividend date: Mar-25-2026
Risk Adjusted Returns v/s
Returns Beta

News
Gujarat Intrux Ltd is Rated Sell
Gujarat Intrux Ltd is rated Sell by MarketsMOJO, with this rating last updated on 29 May 2026. While the rating change occurred on that date, the analysis and financial metrics discussed here reflect the company’s current position as of 15 June 2026, providing investors with the latest insights into the stock’s fundamentals, valuation, financial trends, and technical outlook.
Read full news article
Gujarat Intrux Ltd is Rated Sell
Gujarat Intrux Ltd is rated Sell by MarketsMOJO, with this rating last updated on 29 May 2026. However, the analysis and financial metrics discussed here reflect the stock’s current position as of 02 June 2026, providing investors with the most recent and relevant data to assess the company’s outlook.
Read full news article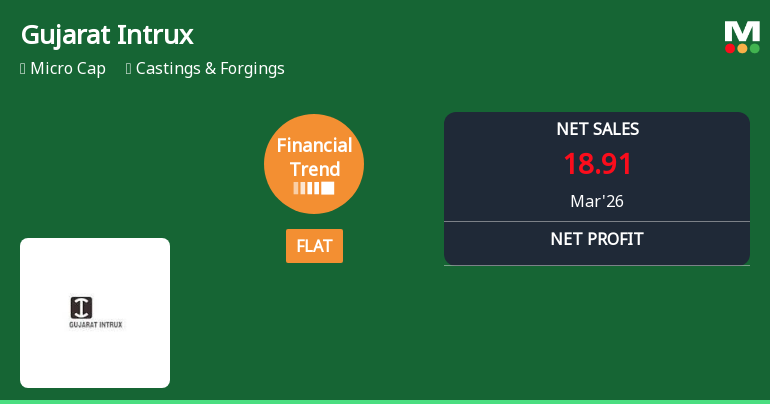
Gujarat Intrux Ltd Reports Flat Quarterly Performance Amid Margin Pressures
Gujarat Intrux Ltd, a micro-cap player in the Castings & Forgings sector, has reported a flat financial performance for the quarter ended March 2026, signalling a notable shift from its previously positive growth trajectory. The company’s latest quarterly results reveal contraction in profitability and operational efficiency, prompting a downgrade in its Mojo Grade from Hold to Sell as of 7 April 2026.
Read full news article Announcements
Announcement under Regulation 30 (LODR)-Newspaper Publication
30-May-2026 | Source : BSEPublication of Financial Results in Newspaper
Compliances-Reg.24(A)-Annual Secretarial Compliance
29-May-2026 | Source : BSEAnnual Secretarial Compliance Report For the year ended on March 31 2026
Board Meeting Outcome for OUTCOME OF THE BOARD MEETING HELD ON 29Th MAY 2026
29-May-2026 | Source : BSEOUTCOME OF THE BOARD MEETING HELD ON 29th MAY 2026
Corporate Actions

No Upcoming Board Meetings

Gujarat Intrux Ltd has declared 75% dividend, ex-date: 25 Mar 26

No Splits history available

No Bonus history available

No Rights history available
Quality key factors
Valuation key factors
Technicals key factors
 Technical Indicator Scale: Bearish, Mildly Bearish, Sideways, Mildly Bullish, Bullish Turned
 Shareholding Snapshot : Mar 2026
Shareholding Compare (%holding)
Promoters
None
Held by 0 Schemes
Held by 0 FIIs
Intolcast Private Limited (9.7%)
Leasecon Investments Pvt Ltd (1.99%)
30.5%
Quarterly Results Snapshot (Standalone) - Mar'26 - QoQ

QoQ Growth in quarter ended Mar 2026 is -7.53% vs 24.92% in Dec 2025
QoQ Growth in quarter ended Mar 2026 is -47.20% vs 42.59% in Dec 2025
Half Yearly Results Snapshot (Standalone) - Sep'25
Growth in half year ended Sep 2025 is -8.10% vs 13.28% in Sep 2024
Growth in half year ended Sep 2025 is -13.94% vs 36.50% in Sep 2024
Nine Monthly Results Snapshot (Standalone) - Dec'25
YoY Growth in nine months ended Dec 2025 is 2.91% vs 14.46% in Dec 2024
YoY Growth in nine months ended Dec 2025 is 3.74% vs 44.77% in Dec 2024
Annual Results Snapshot (Standalone) - Mar'26
YoY Growth in year ended Mar 2026 is 5.23% vs 14.23% in Mar 2025
YoY Growth in year ended Mar 2026 is -2.64% vs 42.91% in Mar 2025
About Gujarat Intrux Ltd

Company Coordinates


