
Key Events This Week
1 June: Quality grade upgraded to "average" with strong sales and EBIT growth
1 June: Valuation shifts classify stock as "very expensive" despite low P/E
5 June: Week closes at Rs.46.70, up 1.41% vs Sensex decline of 0.78%
Jul 08, 03:30 PM
BSE+NSE Vol: 3.41 lacs
Rajasthan Securi for the last several years.

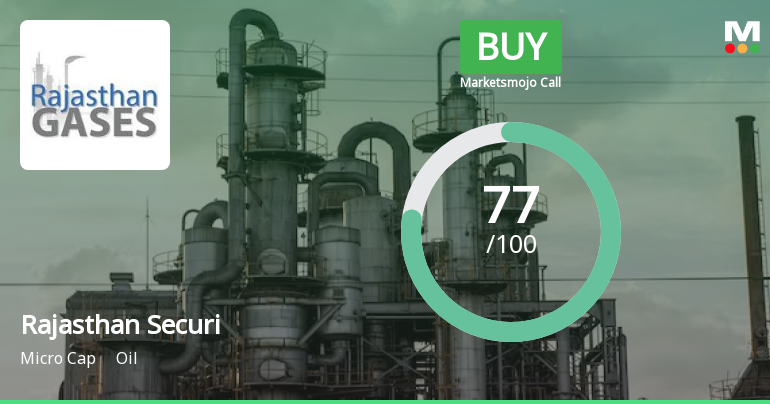
Rajasthan Securities Ltd is rated Buy by MarketsMOJO, with this rating last updated on 01 June 2026. While the rating change occurred on that date, the analysis and financial metrics discussed here reflect the company’s current position as of 03 July 2026, providing investors with the latest insights into the stock’s fundamentals, returns, and technical outlook.
Read full news article
Rajasthan Securities Ltd is rated Buy by MarketsMOJO, with this rating last updated on 01 June 2026. However, the analysis and financial metrics discussed here reflect the stock’s current position as of 22 June 2026, providing investors with the latest insights into its performance and outlook.
Read full news articleWe wish to inform you that pursuant to SEBI (Prohibition of Insider Trading) Regulations 2015 and Companys Code of Conduct to regulate monitor and report trading by Insiders the Trading Window for dealing/trading in the securities of the Company shall remain closed from Wednesday 1st day of July 2026 till the completion of 48 hours after declaration of the Un-audited Financial Results of the Company for the Quarter and Three Months ended on 30th June 2026 to the Stock Exchange. Accordingly the trading window of the company for trading and dealing in the shares of the Company shall remain closed for all the Designated Persons (Insiders/Connected Persons) of the Company from Wednesday 1st day of July 2026 till the completion of 48 hours after declaration of the Un-audited Financial Results of the Company for the Quarter and Three Months ended on 31st March 2026 to the Stock Exchanges.
Pursuant to Regulation 30 and Regulation 47 of the SEBI (Listing Obligations and Disclosure Requirements) Regulations 2015 we hereby enclose copies of the newspaper clipping published regarding of the Extract of Audited Financial Results for the Quarter and Financial Year ended 31st March 2026 in the following newspapers on 30th May 2026. a. Financial Express (English) b. Mahasagar (Marathi)
We enclose herewith a copy of Annual Secretarial Compliance Report for the year ended 31st March 2026 issued by Ms. Rupa Gupta Proprietor of M/s Gupta Rupa & Associates. Practising Company Secretaries (Membership No. F12465 and Peer review No. 12013WB1001500) Kolkata.

No Upcoming Board Meetings

No Dividend history available

No Splits history available

No Bonus history available

No Rights history available
 Technical Indicator Scale: Bearish, Mildly Bearish, Sideways, Mildly Bullish, Bullish Turned
 Non Institution
None
Held by 0 Schemes
Held by 0 FIIs
None
L7 Hitech Private Limited (12.05%)
84.41%
QoQ Growth in quarter ended Mar 2026 is 0.00% vs 0.00% in Dec 2025

QoQ Growth in quarter ended Mar 2026 is 354.86% vs -170.06% in Dec 2025
Growth in half year ended Sep 2025 is 0.00% vs 0.00% in Sep 2024
Growth in half year ended Sep 2025 is 59,828.57% vs 58.82% in Sep 2024
YoY Growth in nine months ended Dec 2025 is 0.00% vs 0.00% in Dec 2024

YoY Growth in nine months ended Dec 2025 is 181.07% vs 2,145.16% in Dec 2024
YoY Growth in year ended Mar 2026 is 0.00% vs 0.00% in Mar 2025
YoY Growth in year ended Mar 2026 is 1,055.35% vs 1,502.00% in Mar 2025


