Oil Country

INR
58.50
0.21 (0.36%)
BSENSE

Jul 07, 03:07 PM

BSE+NSE Vol: 11.06 k

  • Price Points
  • Score
  • Mojo Parameters
  • Total Return
  • News and Corporate Actions
  • Key factors
  • Shareholding
  • Financials
  • CompanyCV
stock-summaryPrice Point
High/Low

1Day

52 Week

Valuation
Technical
Day's Volume

CASH

11.06 k (-43.37%) Volume

Shareholding (Jun 2026)

FII

0.01%

Held by 1 FIIs

DII

0.09%

Held by 0 DIIs

Promoter

51.17%

Why is Oil Country Tubular Ltd falling/rising?

07-Jul-2026

As of 06-Jul, Oil Country Tubular Ltd's stock price is declining at 58.29, down -0.03%. The stock has underperformed recently, with a year-to-date drop of -4.89% and a one-year decline of -36.30%, despite strong long-term growth.

As of 06-Jul, Oil Country Tubular Ltd's stock price is experiencing a slight decline, currently at 58.29, reflecting a change of -0.02 (-0.03%). This downward movement can be attributed to several factors. Over the past week, the stock has underperformed significantly, with a decrease of -1.93%, while the benchmark Sensex has increased by +2.03%. Similarly, the stock has shown a decline of -2.77% over the past month compared to a +5.44% rise in the Sensex.<BR><BR>Year-to-date, the stock is down -4.89%, which is a better performance than the Sensex's -8.14%, but the one-year performance shows a stark decline of -36.30% against the Sensex's -6.17%. Despite a strong performance over the longer term, with increases of +121.30% over three years and +500.93% over five years, the recent trends indicate a struggle for the stock.<BR><BR>Additionally, today's performance indicates that the stock has underperformed its sector by -1.13%. The moving averages suggest mixed signals, as the stock is higher than the 20-day and 100-day moving averages but lower than the 5-day, 50-day, and 200-day moving averages. Furthermore, there is a notable decline in investor participation, with delivery volume on 03 July falling by -39.66% against the 5-day average. This decrease in trading activity may contribute to the stock's current downward trend. Overall, these factors collectively explain the recent decline in the stock price of Oil Country Tubular Ltd.

View full answer

How big is Oil Country?

11-Jun-2026

As of 10th June, Oil Country Tubular Ltd has a market capitalization of 293.00 Cr and reported net sales of 70.10 Cr with a net loss of 61.49 Cr over the latest four quarters.

As of 10th June, <BR><BR>Market Cap: Oil Country Tubular Ltd has a market capitalization of 293.00 Cr, classified as a Micro Cap.<BR><BR>Recent Quarterly Performance: The sum of Net Sales for the latest 4 quarters is 70.10 Cr, while the sum of Net Profit for the same period reflects a loss of 61.49 Cr.<BR><BR>Balance Sheet Snapshot: The reporting period for the balance sheet is March 2025. Shareholder's Funds are valued at 231.42 Cr, and Total Assets amount to 382.01 Cr.

View full answer

Who are in the management team of Oil Country?

11-Jun-2026

The management team of Oil Country includes K Suryanarayana (Executive Chairman), Sridhar Kamineni (Managing Director), and several independent directors: Sunil Tandon, Uma T, and Vijayarama Raju, along with Sudhir Kumar Palo (Company Secretary & Compliance Officer) and Dinakar Vemulapalli (Director).

The management team of Oil Country includes the following individuals:<BR><BR>1. K Suryanarayana - Executive Chairman<BR>2. Sridhar Kamineni - Managing Director<BR>3. Sunil Tandon - Independent Director<BR>4. Uma T - Independent Director<BR>5. Sudhir Kumar Palo - Company Secretary & Compliance Officer<BR>6. Vijayarama Raju - Independent Director<BR>7. Dinakar Vemulapalli - Director<BR><BR>If you need more details about their roles or responsibilities, feel free to ask!

View full answer

Who are the peers of the Oil Country?

11-Jun-2026

Peers of Oil Country include Dolphin Offshore, Gandhar Oil Ref., Guj.Nat.Resour., and others. DHP India shows excellent management risk, while Guj.Nat.Resour. has the highest 1-year return at 59.55%, and Oil Country's return is -23.49%.

Peers: The peers of Oil Country are Dolphin Offshore, Gandhar Oil Ref., Guj.Nat.Resour., Ganesh Benzopl., Rajasthan Securi, GP Petroleums, DHP India, Alphageo (India), and Resgen.<BR><BR>Quality Snapshot: Excellent management risk is observed at DHP India, while Below Average management risk is found at Dolphin Offshore, Guj.Nat.Resour., Alphageo (India), and the rest. Average management risk is present at Gandhar Oil Ref., Ganesh Benzopl., Rajasthan Securi, GP Petroleums, and Resgen. In terms of growth, Excellent growth is noted at Dolphin Offshore and Rajasthan Securi, while Below Average growth is seen at Gandhar Oil Ref., Guj.Nat.Resour., Ganesh Benzopl., Oil Country, GP Petroleums, DHP India, Alphageo (India), and the rest. Capital Structure ratings show Excellent at Ganesh Benzopl., Rajasthan Securi, GP Petroleums, and DHP India, while Below Average is noted at Guj.Nat.Resour., Oil Country, and the rest.<BR><BR>Return Snapshot: The peer with the highest 1-year return is Guj.Nat.Resour. at 59.55%, while the lowest is Resgen at -40.59%. Oil Country's 1-year return of -23.49% is better than Resgen's but worse than Guj.Nat.Resour. Additionally, the peers DHP India, Alphageo (India), and Resgen have negative six-month returns.

View full answer

What does Oil Country do?

10-Jun-2026

Oil Country Tubular Ltd produces casing, tubing, and drill pipe for the oil and gas sector and operates in the micro-cap market. As of March 2026, it reported net sales of 30 Cr and a net loss of 14 Cr, with a market cap of INR 293 Cr.

Overview:<BR>Oil Country Tubular Ltd is engaged in the production of casing, tubing, and drill pipe for the oil and gas sector, operating within the micro-cap market.<BR><BR>History:<BR>Incorporated in February 1985, Oil Country Tubular Ltd has established itself as a leading company in its field. The latest quarterly results reported are for March 2026, showing net sales and profit figures.<BR><BR>Financial Snapshot:<BR>Most recent Net Sales: 30 Cr (Quarterly Results - Mar 2026) <BR>Most recent Net Profit: -14 Cr (Quarterly Results - Mar 2026) <BR>Market-cap value: INR 293 Cr (Micro Cap)<BR><BR>Key Metrics:<BR>P/E: N/A <BR>Industry P/E: 26 <BR>Dividend Yield: 0.00% <BR>Debt-Equity: 0.05 <BR>Return on Equity: -31.15% <BR>Price to Book: 1.50 <BR><BR>Contact Details:<BR>Address: 9 Kanchanjunga, King Kothi Road Hyderabad Telangana : 500001 <BR>Tel: 91-40-24785555 <BR>Email: demat@octlindia.com <BR>Website: http://www.octlindia.com

View full answer

Are Oil Country Tubular Ltd latest results good or bad?

22-May-2026

Oil Country Tubular Ltd's latest results are poor, with a net loss of ₹13.64 crores in Q4 FY26 and ongoing profitability issues, as the company has reported negative results in six of the last seven quarters. Despite a significant increase in net sales, the overall financial situation remains challenging, prompting caution for investors.

The latest results for Oil Country Tubular Ltd indicate a challenging financial situation. In Q4 FY26, the company reported a net loss of ₹13.64 crores, which is a 29.40% decline compared to both the previous quarter and the same quarter last year. While net sales saw a significant quarter-on-quarter increase of 431.32% to ₹29.86 crores, this figure still represents a 13.02% decrease year-on-year from ₹34.33 crores in Q4 FY25.<BR><BR>The operating margin improved to 6.83%, recovering from a deeply negative margin of -69.93% in the previous quarter. However, this is still substantially lower than the 35.92% margin achieved in Q4 FY25, highlighting ongoing profitability issues. Additionally, the profit after tax (PAT) margin remains deeply negative at -45.68%.<BR><BR>Overall, the company has faced persistent losses, reporting negative results in six of the last seven quarters. The significant depreciation charges, which accounted for 58.64% of total revenue, have further exacerbated the financial strain. Given these factors, the results can be characterized as poor, reflecting ongoing operational challenges and a lack of consistent profitability. Investors are advised to approach this stock with caution, as the company appears to be in a difficult position.

View full answer

Should I buy, sell or hold Oil Country Tubular Ltd?

21-May-2026

When is the next results date for Oil Country Tubular Ltd?

13-May-2026

The next results date for Oil Country Tubular Ltd is 21 May 2026.

The next results date for Oil Country Tubular Ltd is scheduled for 21 May 2026.

View full answer

How has been the historical performance of Oil Country?

30-Oct-2025

Oil Country's historical performance shows a significant recovery in net sales and operating income, reaching 122.90 Cr in March 2025, while operating profit improved to 43.15 Cr. However, the company still reported negative profit before tax at -29.10 Cr and profit after tax at -31.86 Cr, despite a positive cash flow from operations of 30.00 Cr.

Answer:<BR>The historical performance of Oil Country shows significant fluctuations in financial metrics over the years, with a notable increase in net sales in March 2025 reaching 122.90 Cr, up from just 18.24 Cr in March 2024 and 0.27 Cr in March 2023. Total operating income followed a similar trend, rising to 122.90 Cr in March 2025 from 18.24 Cr in the previous year. However, the company faced challenges with total expenditure, which increased to 79.75 Cr in March 2025 from 18.13 Cr in March 2024. Operating profit, excluding other income, improved to 43.15 Cr in March 2025, a significant recovery from a loss of 14.10 Cr in March 2023. Despite this, the profit before tax remained negative at -29.10 Cr in March 2025, although it was an improvement from -76.47 Cr in March 2024. The profit after tax also showed a loss of -31.86 Cr in March 2025, compared to -70.45 Cr in March 2024. The company's total liabilities decreased to 382.01 Cr in March 2025 from 426.90 Cr in March 2024, while total assets also declined to 382.01 Cr from 496.63 Cr in the previous year. Cash flow from operating activities turned positive at 30.00 Cr in March 2025, contrasting with a negative cash flow of -18.00 Cr in March 2024.<BR><BR>Breakdown:<BR>Oil Country's financial performance has shown a remarkable increase in net sales, which surged to 122.90 Cr in March 2025 from a mere 0.27 Cr in March 2023, indicating a strong recovery. Total operating income mirrored this growth, reaching 122.90 Cr in March 2025. However, the company faced rising total expenditures, which climbed to 79.75 Cr in March 2025. Operating profit also saw a significant improvement, moving to 43.15 Cr in March 2025 from a loss of 14.10 Cr in March 2023. Despite these gains, the profit before tax remained negative at -29.10 Cr, though it was an improvement from -76.47 Cr in the previous year. The profit after tax also reflected a loss of -31.86 Cr in March 2025. On the balance sheet, total liabilities decreased to 382.01 Cr, while total assets fell to the same figure, indicating a tightening of the company's financial position. Cash flow from operating activities turned positive at 30.00 Cr, contrasting with the previous year's negative cash flow, suggesting improved operational efficiency.

View full answer

Who are the top shareholders of the Oil Country?

17-Jul-2025

The top shareholders of Oil Country include United Steel Allied Industries Private Limited, which holds 42.68%, and individual investors with 36.53%. The highest public shareholder is Rajagiridhar Kumar Nimmagadda at 3.14%, while institutional holdings are minimal.

The top shareholders of Oil Country include the promoters, who hold a significant majority of the shares. The promoter with the highest holding is United Steel Allied Industries Private Limited, which owns 42.68% of the company. Additionally, individual investors collectively hold 36.53% of the shares. <BR><BR>In terms of institutional holdings, there are five mutual fund schemes that hold a small percentage (0.05%), and two foreign institutional investors (FIIs) that hold 0.07%. The highest public shareholder is Rajagiridhar Kumar Nimmagadda, with a holding of 3.14%. <BR><BR>Overall, the promoter group has a strong presence in the company's shareholding structure.

View full answer

Is Oil Country overvalued or undervalued?

09-Jun-2025

As of April 25, 2023, Oil Country is rated as risky and overvalued with a PE ratio of -11.92, an EV to EBITDA of 9.39, and a ROE of -13.77%, despite its 112.70% one-year stock return outpacing the Sensex's 7.61%, indicating speculative interest amid financial challenges.

As of 25 April 2023, the valuation grade for Oil Country has moved from does not qualify to risky. The company is currently considered overvalued. Key ratios include a PE ratio of -11.92, an EV to EBITDA of 9.39, and a ROE of -13.77%. <BR><BR>In comparison with peers, JSW Steel has a PE of 64.98 and Tata Steel boasts a PE of 51.92, highlighting the significant disparity in valuation metrics. Additionally, Oil Country's recent stock performance has outpaced the Sensex, with a 1-year return of 112.70% compared to the Sensex's 7.61%, which may suggest a speculative interest despite its underlying financial challenges.

View full answer

What is the technical trend for Oil Country?

09-Jun-2025

As of March 26, 2025, the technical outlook for Oil Country is mildly bullish, supported by daily moving averages and Bollinger Bands, despite some mixed signals from indicators like the weekly MACD and KST.

As of 26 March 2025, the technical trend for Oil Country has changed from bullish to mildly bullish. The weekly MACD indicates a mildly bearish stance, while the monthly MACD remains bullish. The daily moving averages are bullish, supporting the mildly bullish outlook. Bollinger Bands are bullish on both weekly and monthly time frames. Dow Theory shows a mildly bullish trend on both weekly and monthly levels. However, the weekly KST and OBV are mildly bearish, which adds some caution to the overall assessment. The current price of 76.06 is below the previous close of 79.40, indicating some short-term weakness. Overall, the technical stance is mildly bullish, driven primarily by the daily moving averages and Bollinger Bands, despite some mixed signals from other indicators.

View full answer

Has Oil Country declared dividend?

06-Jun-2025

Yes, Oil Country Tubular Ltd has declared a 20% dividend, amounting to $2.00 per share, with an ex-date of May 29, 2014; however, the dividend yield is 0%. Despite this, the company has shown significant price appreciation, resulting in total returns of up to 1610.53% over five years.

Oil Country Tubular Ltd has declared a 20% dividend.<BR><BR>Dividend Details:<BR>- Percentage announced: 20%<BR>- Amount per share: 2.0000<BR>- Ex-date: May-29-2014<BR><BR>Dividend Yield: 0%<BR><BR>Total Returns by Period:<BR>In the 6-month period, the price return was 23.32%, the dividend return was 0%, resulting in a total return of 23.32%.<BR><BR>In the 1-year period, the price return was 119.72%, the dividend return was 0%, leading to a total return of 119.72%.<BR><BR>Over the 2-year period, the price return reached 362.36%, with a dividend return of 0%, culminating in a total return of 362.36%.<BR><BR>In the 3-year period, the price return was 831.9%, the dividend return remained at 0%, resulting in a total return of 831.9%.<BR><BR>For the 4-year period, the price return was 1040.35%, with a dividend return of 0%, giving a total return of 1040.35%.<BR><BR>In the 5-year period, the price return soared to 1610.53%, while the dividend return was 0%, resulting in a total return of 1610.53%.<BR><BR>Overall, Oil Country Tubular Ltd has declared a dividend, but the dividend yield remains at 0%. The total returns over various periods indicate significant price appreciation, suggesting strong performance despite the lack of ongoing dividend income.

View full answer
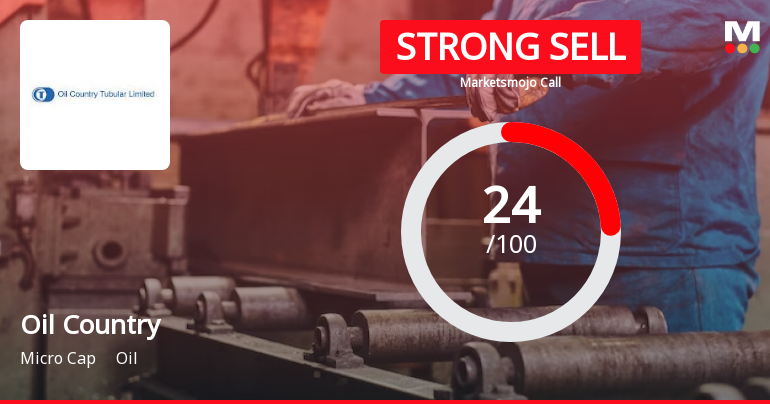
iScoreScore
Click here to find our call on this stock
Strong Sell
Sell
Hold
Buy
Strong Buy

Dashboard

1

Weak Long Term Fundamental Strength with a -150.00% CAGR growth in Operating Profits over the last 5 years

  • Low ability to service debt as the company has a high Debt to EBITDA ratio of 5.42 times
  • The company has reported losses. Due to this company has reported negative ROCE
2

The company has declared negative results for the last 3 consecutive quarters

3

Risky - Negative Operating Profits

stock-summaryMojo Parameters

Mojo Parameters

Loading Valuation Snapshot...

Stock DNA

stock-summary
Industry

Oil

stock-summary
Market cap

INR 301 Cr (Micro Cap)

stock-summary
P/E

NA (Loss Making)

stock-summary
Industry P/E

26

stock-summary
Dividend Yield

0.00%

stock-summary
Debt Equity

0.05

stock-summary
Return on Equity

-31.15%

stock-summary
Price to Book

1.53

Revenue and Profits:
Net Sales:
30 Cr
(Quarterly Results - Mar 2026)
Net Profit:
-14 Cr
stock-summaryTotal Returns
Total Returns (Price + Dividend) stock-summary
Dividend Yield (0%)
TimePeriod
Price Return
Dividend Return
Total Return
3 Months
44.44%
0%
44.44%
6 Months
-1.05%
0%
-1.05%
1 Year
-36.24%
0%
-36.24%
2 Years
48.63%
0%
48.63%
3 Years
111.57%
0%
111.57%
4 Years
661.72%
0%
661.72%
5 Years
525.67%
0%
525.67%

Latest dividend: 2.0000 per share ex-dividend date: May-29-2014

Risk Adjusted Returns v/s stock-summary
Returns Beta
Icon
Beta has not been calculated since enough price history is not available
stock-summaryNews & Corporate Actions

Announcements stock-summary

Compliances-Certificate under Reg. 74 (5) of SEBI (DP) Regulations 2018

03-Jul-2026 | Source : BSE

Certificate under Regulation 74(5) of SEBI (DP) Regulations 2018.

Closure of Trading Window

26-Jun-2026 | Source : BSE

Intimation of Closure of Trading Window

Disclosures under Reg. 29(2) of SEBI (SAST) Regulations 2011

22-Jun-2026 | Source : BSE

The Exchange has received the disclosure under Regulation 29(2) of SEBI (Substantial Acquisition of Shares & Takeovers) Regulations 2011 for United Steel Allied Industries Pvt Ltd

Corporate Actions stock-summary

stock-summary
BOARD MEETING

No Upcoming Board Meetings

stock-summary
DIVIDEND

Oil Country Tubular Ltd has declared 20% dividend, ex-date: 29 May 14

stock-summary
SPLITS

No Splits history available

stock-summary
BONUS

No Bonus history available

stock-summary
RIGHTS

No Rights history available

stock-summaryKey Factors

Quality key factors stock-summary

Factor
Value
Sales Growth (5y)
99.47%
EBIT Growth (5y)
-150.00%
EBIT to Interest (avg)
-16.41
Debt to EBITDA (avg)
3.29
Net Debt to Equity (avg)
0.05
Sales to Capital Employed (avg)
0.19
Tax Ratio
4.46%
Dividend Payout Ratio
0
Pledged Shares
0
Institutional Holding
0.10%
ROCE (avg)
-22.87%
ROE (avg)
8.38%

Valuation key factors

Factor
Value
P/E Ratio
NA (Loss Making)
Industry P/E
26
Price to Book Value
1.53
EV to EBIT
-4.79
EV to EBITDA
67.89
EV to Capital Employed
1.50
EV to Sales
4.45
PEG Ratio
NA
Dividend Yield
NA
ROCE (Latest)
-31.32%
ROE (Latest)
-31.15%

Technicals key factors

Indicator
Weekly
Monthly
MACD
Bullish
Mildly Bearish
RSI
No Signal
Bearish
Bollinger Bands
Mildly Bullish
Bearish
Moving Averages
Bearish (Daily)
KST
Bullish
Mildly Bearish
Dow Theory
No Trend
No Trend
OBV
No Trend
No Trend
stock-summary Technical Indicator Scale: Bearish, Mildly Bearish, Sideways, Mildly Bullish, Bullish  Turned 
stock-summaryShareholding
Shareholding Snapshot : Jun 2026stock-summary
Shareholding Compare (%holding) stock-summary
Majority shareholders

Promoters

Pledged Promoter Holdings

None

Mutual Funds

Held by 5 Schemes (0.04%)

FIIs

Held by 1 FIIs (0.01%)

Promoter with highest holding

United Steel Allied Industries Pvt Ltd (38.17%)

Highest Public shareholder

Vivek Mundra (8.12%)

Individual Investors Holdings

33.97%

stock-summaryFinancial
[
  {
    "link": "quarterly",
    "btn_text": "All Quarterly Results",
    "header": "Quarterly Results Snapshot (Standalone) - Mar'26 - YoY",
    "rhs": [
      {
        "prefix": "Net Sales ",
        "suffix": "YoY Growth in quarter ended Mar 2026 is -13.02% vs 204.07% in Mar 2025",
        "dir": -1
      },
      {
        "prefix": "Standalone Net Profit ",
        "suffix": "YoY Growth in quarter ended Mar 2026 is -29.41% vs 28.01% in Mar 2025",
        "dir": -1
      }
    ],
    "table": {
      "header": [
        "Mar'26",
        "Mar'25",
        "Change(%)"
      ],
      "body": [
        {
          "field": "Net Sales",
          "val1": "29.86",
          "val2": "34.33",
          "chgp": "-13.02%",
          "chgp_class": "negative"
        },
        {
          "field": "Operating Profit (PBDIT) excl Other Income",
          "val1": "2.04",
          "val2": "12.33",
          "chgp": "-83.45%",
          "chgp_class": "negative"
        },
        {
          "field": "Interest",
          "val1": "0.16",
          "val2": "0.35",
          "chgp": "-54.29%",
          "chgp_class": "positive"
        },
        {
          "field": "Exceptional Items",
          "val1": "0.00",
          "val2": "0.00",
          "chgp": "",
          "chgp_class": "neutral"
        },
        {
          "field": "Standalone Net Profit",
          "val1": "-13.64",
          "val2": "-10.54",
          "chgp": "-29.41%",
          "chgp_class": "negative"
        },
        {
          "field": "Operating Profit Margin (Excl OI)",
          "val1": "6.83%",
          "val2": "35.92%",
          "chgp": "-29.09%",
          "chgp_class": "negative"
        }
      ]
    }
  },
  {
    "link": "half-yearly",
    "btn_text": "All Half Yearly Results",
    "header": "Half Yearly Results Snapshot (Standalone) - Sep'25",
    "rhs": [
      {
        "prefix": "Net Sales ",
        "suffix": " Growth in half year ended Sep 2025 is -26.90% vs 4,782.47% in Sep 2024",
        "dir": -1
      },
      {
        "prefix": "Standalone Net Profit ",
        "suffix": " Growth in half year ended Sep 2025 is -32.27% vs 31.56% in Sep 2024",
        "dir": -1
      }
    ],
    "table": {
      "header": [
        "Sep'25",
        "Sep'24",
        "Change(%)"
      ],
      "body": [
        {
          "field": "Net Sales",
          "val1": "34.62",
          "val2": "47.36",
          "chgp": "-26.90%",
          "chgp_class": "negative"
        },
        {
          "field": "Operating Profit (PBDIT) excl Other Income",
          "val1": "6.47",
          "val2": "14.03",
          "chgp": "-53.88%",
          "chgp_class": "negative"
        },
        {
          "field": "Interest",
          "val1": "0.76",
          "val2": "3.36",
          "chgp": "-77.38%",
          "chgp_class": "positive"
        },
        {
          "field": "Exceptional Items",
          "val1": "0.00",
          "val2": "0.00",
          "chgp": "",
          "chgp_class": "neutral"
        },
        {
          "field": "Standalone Net Profit",
          "val1": "-30.37",
          "val2": "-22.96",
          "chgp": "-32.27%",
          "chgp_class": "negative"
        },
        {
          "field": "Operating Profit Margin (Excl OI)",
          "val1": "18.69%",
          "val2": "29.62%",
          "chgp": "-10.93%",
          "chgp_class": "negative"
        }
      ]
    }
  },
  {
    "link": "nine-monthly",
    "btn_text": "All Nine Monthly Results",
    "header": "Nine Monthly Results Snapshot (Standalone) - Dec'25",
    "rhs": [
      {
        "prefix": "Net Sales ",
        "suffix": "YoY Growth in nine months ended Dec 2025 is -54.57% vs 1,174.39% in Dec 2024",
        "dir": -1
      },
      {
        "prefix": "Standalone Net Profit ",
        "suffix": "YoY Growth in nine months ended Dec 2025 is -124.39% vs 57.10% in Dec 2024",
        "dir": -1
      }
    ],
    "table": {
      "header": [
        "Dec'25",
        "Dec'24",
        "Change(%)"
      ],
      "body": [
        {
          "field": "Net Sales",
          "val1": "40.24",
          "val2": "88.57",
          "chgp": "-54.57%",
          "chgp_class": "negative"
        },
        {
          "field": "Operating Profit (PBDIT) excl Other Income",
          "val1": "2.54",
          "val2": "30.83",
          "chgp": "-91.76%",
          "chgp_class": "negative"
        },
        {
          "field": "Interest",
          "val1": "0.92",
          "val2": "5.16",
          "chgp": "-82.17%",
          "chgp_class": "positive"
        },
        {
          "field": "Exceptional Items",
          "val1": "0.00",
          "val2": "0.00",
          "chgp": "",
          "chgp_class": "neutral"
        },
        {
          "field": "Standalone Net Profit",
          "val1": "-47.84",
          "val2": "-21.32",
          "chgp": "-124.39%",
          "chgp_class": "negative"
        },
        {
          "field": "Operating Profit Margin (Excl OI)",
          "val1": "6.31%",
          "val2": "34.81%",
          "chgp": "-28.50%",
          "chgp_class": "negative"
        }
      ]
    }
  },
  {
    "link": "annual",
    "btn_text": "All Annual Results",
    "header": "Annual Results Snapshot (Standalone) - Mar'26",
    "rhs": [
      {
        "prefix": "Net Sales ",
        "suffix": "YoY Growth in year ended Mar 2026 is -42.97% vs 573.79% in Mar 2025",
        "dir": -1
      },
      {
        "prefix": "Standalone Net Profit ",
        "suffix": "YoY Growth in year ended Mar 2026 is -92.97% vs 54.78% in Mar 2025",
        "dir": -1
      }
    ],
    "table": {
      "header": [
        "Mar'26",
        "Mar'25",
        "Change(%)"
      ],
      "body": [
        {
          "field": "Net Sales",
          "val1": "70.09",
          "val2": "122.90",
          "chgp": "-42.97%",
          "chgp_class": "negative"
        },
        {
          "field": "Operating Profit (PBDIT) excl Other Income",
          "val1": "4.58",
          "val2": "43.15",
          "chgp": "-89.39%",
          "chgp_class": "negative"
        },
        {
          "field": "Interest",
          "val1": "1.08",
          "val2": "5.51",
          "chgp": "-80.40%",
          "chgp_class": "positive"
        },
        {
          "field": "Exceptional Items",
          "val1": "0.00",
          "val2": "0.00",
          "chgp": "",
          "chgp_class": "neutral"
        },
        {
          "field": "Standalone Net Profit",
          "val1": "-61.48",
          "val2": "-31.86",
          "chgp": "-92.97%",
          "chgp_class": "negative"
        },
        {
          "field": "Operating Profit Margin (Excl OI)",
          "val1": "6.53%",
          "val2": "35.11%",
          "chgp": "-28.58%",
          "chgp_class": "negative"
        }
      ]
    }
  }
]

Quarterly Results Snapshot (Standalone) - Mar'26 - YoYstock-summary

Mar'26
Mar'25
Change(%)
Net Sales
29.86
34.33
-13.02%
Operating Profit (PBDIT) excl Other Income
2.04
12.33
-83.45%
Interest
0.16
0.35
-54.29%
Exceptional Items
0.00
0.00
Standalone Net Profit
-13.64
-10.54
-29.41%
Operating Profit Margin (Excl OI)
6.83%
35.92%
-29.09%
Values in Rs Cr.
Direction Arrows
Net Sales

YoY Growth in quarter ended Mar 2026 is -13.02% vs 204.07% in Mar 2025

Direction Arrows
Standalone Net Profit

YoY Growth in quarter ended Mar 2026 is -29.41% vs 28.01% in Mar 2025

Half Yearly Results Snapshot (Standalone) - Sep'25stock-summary

Sep'25
Sep'24
Change(%)
Net Sales
34.62
47.36
-26.90%
Operating Profit (PBDIT) excl Other Income
6.47
14.03
-53.88%
Interest
0.76
3.36
-77.38%
Exceptional Items
0.00
0.00
Standalone Net Profit
-30.37
-22.96
-32.27%
Operating Profit Margin (Excl OI)
18.69%
29.62%
-10.93%
Values in Rs Cr.
Direction Arrows
Net Sales

Growth in half year ended Sep 2025 is -26.90% vs 4,782.47% in Sep 2024

Direction Arrows
Standalone Net Profit

Growth in half year ended Sep 2025 is -32.27% vs 31.56% in Sep 2024

Nine Monthly Results Snapshot (Standalone) - Dec'25stock-summary

Dec'25
Dec'24
Change(%)
Net Sales
40.24
88.57
-54.57%
Operating Profit (PBDIT) excl Other Income
2.54
30.83
-91.76%
Interest
0.92
5.16
-82.17%
Exceptional Items
0.00
0.00
Standalone Net Profit
-47.84
-21.32
-124.39%
Operating Profit Margin (Excl OI)
6.31%
34.81%
-28.50%
Values in Rs Cr.
Direction Arrows
Net Sales

YoY Growth in nine months ended Dec 2025 is -54.57% vs 1,174.39% in Dec 2024

Direction Arrows
Standalone Net Profit

YoY Growth in nine months ended Dec 2025 is -124.39% vs 57.10% in Dec 2024

Annual Results Snapshot (Standalone) - Mar'26stock-summary

Mar'26
Mar'25
Change(%)
Net Sales
70.09
122.90
-42.97%
Operating Profit (PBDIT) excl Other Income
4.58
43.15
-89.39%
Interest
1.08
5.51
-80.40%
Exceptional Items
0.00
0.00
Standalone Net Profit
-61.48
-31.86
-92.97%
Operating Profit Margin (Excl OI)
6.53%
35.11%
-28.58%
Values in Rs Cr.
Direction Arrows
Net Sales

YoY Growth in year ended Mar 2026 is -42.97% vs 573.79% in Mar 2025

Direction Arrows
Standalone Net Profit

YoY Growth in year ended Mar 2026 is -92.97% vs 54.78% in Mar 2025

stock-summaryCompany CV
About Oil Country Tubular Ltd stock-summary
stock-summary
Oil Country Tubular Ltd
Micro Cap
Oil
Incorporated in Feb.'85, Oil Country Tubular Limited (OCTL) was promoted by United Steel Allied Industries, K Suryanarayana and their Associates. The Company is engaged in the business of producing, Casing, Tubing and Drill Pipe that are used in the Oil and Gas Sector for the drilling and exploration of Oil and Gas. OCTL is an unique integrated facility established in 1989 and is one of the leading Companies in the world, processing a wide range of Oil Country tubular Goods viz.
Company Coordinates stock-summary
Company Details
9 Kanchanjunga, King Kothi Road Hyderabad Telangana : 500001
stock-summary
Tel: 91-40-24785555
stock-summary
demat@octlindia.com
Registrar Details
XL Softech Systems Ltd , 3 Sagar Society Road , No 2 Banjara Hills, Hyderabad