
Compare Federal-Mogul Go with Similar Stocks
Stock DNA
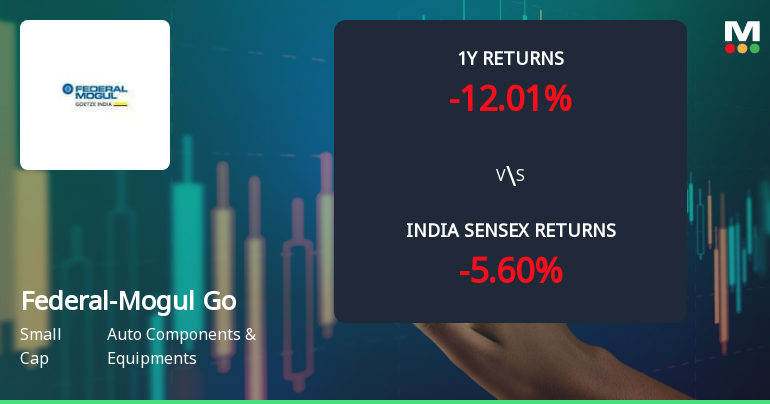
Auto Components & Equipments
INR 2,585 Cr (Small Cap)
14.00
37
0.00%
-0.58
12.80%
1.76
Total Returns (Price + Dividend) 
Federal-Mogul Go for the last several years.
Risk Adjusted Returns v/s
Returns Beta

News
Federal-Mogul Goetze (India) Ltd Technical Momentum Shifts Amid Mixed Signals
Federal-Mogul Goetze (India) Ltd has experienced a notable shift in its technical momentum, moving from a mildly bearish stance to a sideways trend. Despite a recent upgrade in its technical outlook on weekly charts, mixed signals from key indicators such as MACD, RSI, and moving averages suggest a cautious approach for investors navigating the auto components sector.
Read full news article
Federal-Mogul Goetze (India) Ltd is Rated Sell
Federal-Mogul Goetze (India) Ltd is rated 'Sell' by MarketsMOJO, with this rating last updated on 26 May 2026. However, the analysis and financial metrics discussed here reflect the stock's current position as of 18 June 2026, providing investors with an up-to-date view of the company’s fundamentals, returns, and market performance.
Read full news article
Federal-Mogul Goetze (India) Ltd Technical Momentum Shifts Amid Mixed Market Signals
Federal-Mogul Goetze (India) Ltd, a small-cap player in the Auto Components & Equipments sector, has experienced a subtle shift in its technical momentum, moving from a sideways trend to a mildly bearish stance. Despite some bullish weekly indicators, monthly signals suggest caution, reflecting a complex interplay of market forces as the stock trades near ₹440, down 1.20% on 16 Jun 2026.
Read full news article Announcements
Announcement under Regulation 30 (LODR)-Newspaper Publication
27-May-2026 | Source : BSEPursuant to Reg 47 of SEBI (LODR) Reg 2015 please find attached herewith the copies of the Audited Financial Statement of the Company for the Quarter/Year ended 31st March 2026 published in Financial Express (English) & Jansatta (Hindi) dt. 27th May 2026. The statement were approved by the Board of Directors of the Company in its meeting held on 25th May 2026.
Schedule Of Annual General Meeting (AGM)
26-May-2026 | Source : BSEWe wish to inform you that in the Outcome of the Board Meeting submitted on 25th May 2026 for the meeting held on the same day the date of the AGM was inadvertently mentioned as August 25 2026. In this regard we would like to disseminate the correct and revised schedule of the 71st AGM of the Company as September 24 2026 Thursday through Video Conferencing.
Board Meeting Intimation for Approval Of The Audited Financial Statement Of The Company For The Year Ended On 31St March 2026.
15-May-2026 | Source : BSEFederal-Mogul Goetze (India) Ltdhas informed BSE that the meeting of the Board of Directors of the Company is scheduled on 25/05/2026 inter alia to consider and approve The Audited Financial Statement of the Company for the year ended on 31st March 2026.
Corporate Actions

No Upcoming Board Meetings

No Dividend history available

No Splits history available

No Bonus history available

Federal-Mogul Goetze (India) Ltd has announced 71:100 rights issue, ex-date: 03 Nov 08
Quality key factors
Valuation key factors
Technicals key factors
 Technical Indicator Scale: Bearish, Mildly Bearish, Sideways, Mildly Bullish, Bullish Turned
 Shareholding Snapshot : Mar 2026
Shareholding Compare (%holding)
Promoters
None
Held by 5 Schemes (0.0%)
Held by 26 FIIs (0.38%)
Federal Mogul Holdings Ltd. (60.05%)
Rajasthan Global Securities Private Limited (3.15%)
16.62%
Quarterly Results Snapshot (Consolidated) - Mar'26 - YoY

YoY Growth in quarter ended Mar 2026 is 6.50% vs 7.23% in Mar 2025
YoY Growth in quarter ended Mar 2026 is -17.28% vs 47.26% in Mar 2025
Half Yearly Results Snapshot (Consolidated) - Sep'25

Growth in half year ended Sep 2025 is 7.24% vs 6.49% in Sep 2024
Growth in half year ended Sep 2025 is 25.42% vs 18.79% in Sep 2024
Nine Monthly Results Snapshot (Consolidated) - Dec'25
YoY Growth in nine months ended Dec 2025 is 9.57% vs 5.81% in Dec 2024
YoY Growth in nine months ended Dec 2025 is 18.39% vs 18.59% in Dec 2024
Annual Results Snapshot (Consolidated) - Mar'26
YoY Growth in year ended Mar 2026 is 8.79% vs 6.17% in Mar 2025
YoY Growth in year ended Mar 2026 is 5.33% vs 27.70% in Mar 2025
About Federal-Mogul Goetze (India) Ltd

Company Coordinates


