
Compare Art Nirman Ltd with Similar Stocks
Dashboard
Weak Long Term Fundamental Strength with a -2.53% CAGR growth in Net Sales over the last 5 years
- Company's ability to service its debt is weak with a poor EBIT to Interest (avg) ratio of -0.22
- The company has been able to generate a Return on Equity (avg) of 2.64% signifying low profitability per unit of shareholders funds
With ROCE of 5.5, it has a Expensive valuation with a 2.3 Enterprise value to Capital Employed
Below par performance in long term as well as near term
Total Returns (Price + Dividend) 
Art Nirman Ltd for the last several years.
Risk Adjusted Returns v/s
Returns Beta

News

Art Nirman Ltd is Rated Strong Sell
Art Nirman Ltd is rated Strong Sell by MarketsMOJO, with this rating last updated on 15 June 2026. However, the analysis and financial metrics discussed here reflect the stock’s current position as of 27 June 2026, providing investors with the latest insights into the company’s performance and outlook.
Read full news article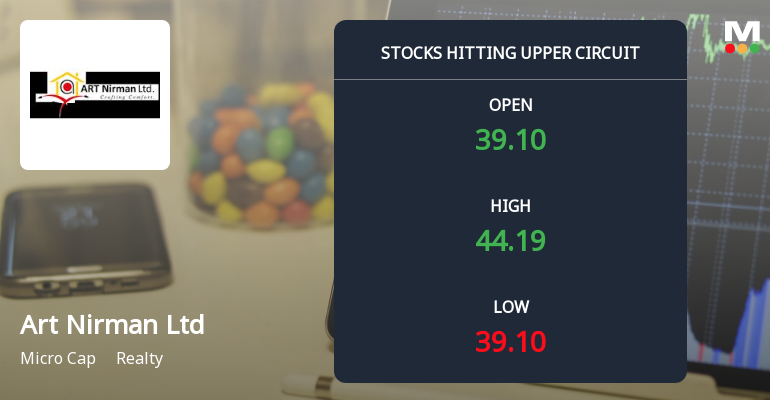
Art Nirman Ltd Locks at Upper Circuit With 3.33% Gain — Buyers Queue, Sellers Absent
At Rs 44.19, the buying was done — not because demand dried up, but because the exchange wouldn't let the stock go any higher. Art Nirman Ltd locked at its upper circuit of 10% on 22 Jun 2026, with buyers queuing and no sellers willing to part with shares.
Read full news article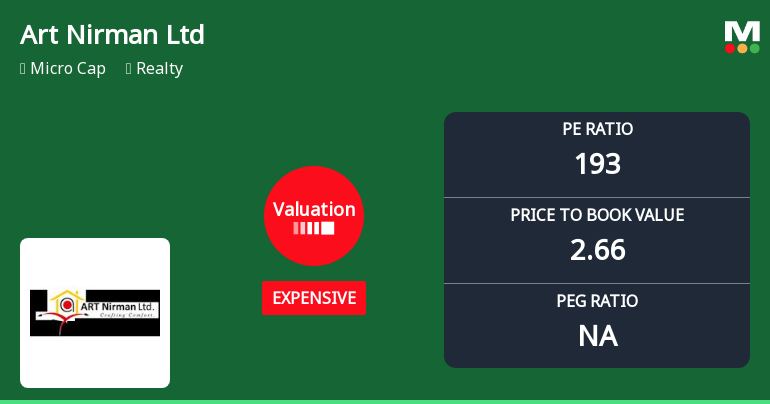
Art Nirman Ltd Valuation Shifts Signal Elevated Price Risk Amid Weak Returns
Art Nirman Ltd, a micro-cap player in the Realty sector, has seen its valuation metrics shift markedly, raising concerns about price attractiveness. With its price-to-earnings (P/E) ratio soaring to 192.83 and price-to-book value (P/BV) at 2.66, the stock now trades at a premium compared to its historical averages and peer group, prompting a downgrade to a Strong Sell rating by MarketsMOJO as of 15 June 2026.
Read full news article Announcements
Art Nirman Limited - Outcome of Board Meeting
14-Nov-2019 | Source : NSEArt Nirman Limited has informed the Exchange regarding Board meeting held on November 13, 2019 for the approval of financial results for half year ended on 30th September, 2019.
Art Nirman Limited - Shareholders meeting
26-Sep-2019 | Source : NSEArt Nirman Limited has informed the Exchange regarding Proceedings of Annual General Meeting held on September 26, 2019
Art Nirman Limited - Trading Window
25-Sep-2019 | Source : NSEArt Nirman Limited has informed the Exchange regarding the Trading Window closure pursuant to SEBI (Prohibition of Insider Trading) Regulations, 2015
Corporate Actions

No Upcoming Board Meetings

No Dividend history available

No Splits history available

No Bonus history available

No Rights history available
Quality key factors
Valuation key factors
Technicals key factors
 Technical Indicator Scale: Bearish, Mildly Bearish, Sideways, Mildly Bullish, Bullish Turned
 Shareholding Snapshot : Mar 2026
Shareholding Compare (%holding)
Promoters
None
Held by 0 Schemes
Held by 0 FIIs
Ashokkumar Raghuram Thakker (66.75%)
Ajaykumar Jamnalal Pujara (3.43%)
22.34%
Quarterly Results Snapshot (Standalone) - Mar'26 - YoY

YoY Growth in quarter ended Mar 2026 is 152.02% vs -33.33% in Mar 2025

YoY Growth in quarter ended Mar 2026 is -88.31% vs 250.00% in Mar 2025
Half Yearly Results Snapshot (Standalone) - Sep'25
Growth in half year ended Sep 2025 is -40.90% vs -18.65% in Sep 2024
Growth in half year ended Sep 2025 is -61.70% vs 9.30% in Sep 2024
Nine Monthly Results Snapshot (Standalone) - Dec'25
YoY Growth in nine months ended Dec 2025 is -41.77% vs -11.72% in Dec 2024
YoY Growth in nine months ended Dec 2025 is -64.75% vs 29.79% in Dec 2024
Annual Results Snapshot (Standalone) - Mar'26
YoY Growth in year ended Mar 2026 is 21.36% vs -20.12% in Mar 2025
YoY Growth in year ended Mar 2026 is -73.87% vs 68.64% in Mar 2025
About Art Nirman Ltd

Company Coordinates


