
Compare Art Nirman Ltd with Similar Stocks
Dashboard
Weak Long Term Fundamental Strength with a -2.53% CAGR growth in Net Sales over the last 5 years
- Company's ability to service its debt is weak with a poor EBIT to Interest (avg) ratio of -0.22
- The company has been able to generate a Return on Equity (avg) of 2.64% signifying low profitability per unit of shareholders funds
Below par performance in long term as well as near term
Total Returns (Price + Dividend) 
Art Nirman Ltd for the last several years.
Risk Adjusted Returns v/s
Returns Beta

News
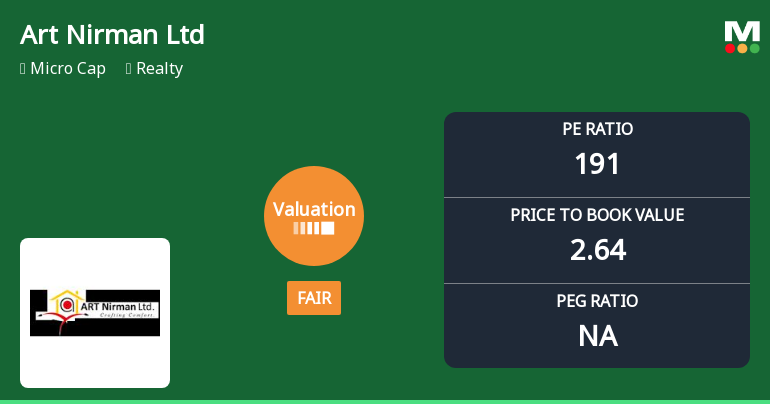
Art Nirman Ltd Valuation Shifts Signal Changing Market Sentiment
Art Nirman Ltd, a micro-cap player in the realty sector, has witnessed a notable shift in its valuation parameters, moving from an expensive to a fair valuation grade. Despite this improvement, the company continues to face significant headwinds, reflected in its subdued price performance and modest return ratios compared to sector peers and broader market benchmarks.
Read full news article
Art Nirman Ltd is Rated Strong Sell
Art Nirman Ltd is rated Strong Sell by MarketsMOJO, with this rating last updated on 15 June 2026. However, the analysis and financial metrics discussed here reflect the stock’s current position as of 08 July 2026, providing investors with the most up-to-date view of the company’s performance and outlook.
Read full news article
Art Nirman Ltd Valuation Shifts Signal Changing Market Sentiment in Realty Sector
Art Nirman Ltd, a micro-cap player in the Realty sector, has seen a notable shift in its valuation parameters, moving from an expensive to a fair valuation grade. Despite this adjustment, the company continues to face significant headwinds, reflected in its deteriorating share price and weak financial metrics compared to peers and broader market benchmarks.
Read full news article Announcements
Art Nirman Limited - Outcome of Board Meeting
14-Nov-2019 | Source : NSEArt Nirman Limited has informed the Exchange regarding Board meeting held on November 13, 2019 for the approval of financial results for half year ended on 30th September, 2019.
Art Nirman Limited - Shareholders meeting
26-Sep-2019 | Source : NSEArt Nirman Limited has informed the Exchange regarding Proceedings of Annual General Meeting held on September 26, 2019
Art Nirman Limited - Trading Window
25-Sep-2019 | Source : NSEArt Nirman Limited has informed the Exchange regarding the Trading Window closure pursuant to SEBI (Prohibition of Insider Trading) Regulations, 2015
Corporate Actions

No Upcoming Board Meetings

No Dividend history available

No Splits history available

No Bonus history available

No Rights history available
Quality key factors
Valuation key factors
Technicals key factors
 Technical Indicator Scale: Bearish, Mildly Bearish, Sideways, Mildly Bullish, Bullish Turned
 Shareholding Snapshot : Mar 2026
Shareholding Compare (%holding)
Promoters
None
Held by 0 Schemes
Held by 0 FIIs
Ashokkumar Raghuram Thakker (66.75%)
Ajaykumar Jamnalal Pujara (3.43%)
22.34%
Quarterly Results Snapshot (Standalone) - Mar'26 - YoY

YoY Growth in quarter ended Mar 2026 is 152.02% vs -33.33% in Mar 2025

YoY Growth in quarter ended Mar 2026 is -88.31% vs 250.00% in Mar 2025
Half Yearly Results Snapshot (Standalone) - Sep'25
Growth in half year ended Sep 2025 is -40.90% vs -18.65% in Sep 2024
Growth in half year ended Sep 2025 is -61.70% vs 9.30% in Sep 2024
Nine Monthly Results Snapshot (Standalone) - Dec'25
YoY Growth in nine months ended Dec 2025 is -41.77% vs -11.72% in Dec 2024
YoY Growth in nine months ended Dec 2025 is -64.75% vs 29.79% in Dec 2024
Annual Results Snapshot (Standalone) - Mar'26
YoY Growth in year ended Mar 2026 is 21.36% vs -20.12% in Mar 2025
YoY Growth in year ended Mar 2026 is -73.87% vs 68.64% in Mar 2025
About Art Nirman Ltd

Company Coordinates


