
Compare Avadh Sugar with Similar Stocks
Dashboard
Weak Long Term Fundamental Strength with a -5.43% CAGR growth in Operating Profits over the last 5 years
- Low ability to service debt as the company has a high Debt to EBITDA ratio of 6.36 times
- The company has been able to generate a Return on Capital Employed (avg) of 9.94% signifying low profitability per unit of total capital (equity and debt)
- PBT LESS OI(Q) At Rs 82.65 cr has Fallen at -25.24%
- PAT(Q) At Rs 55.03 cr has Fallen at -23.2%
- ROCE(HY) Lowest at 6.50%
Falling Participation by Institutional Investors
Consistent Underperformance against the benchmark over the last 3 years
Total Returns (Price + Dividend) 
Latest dividend: 10 per share ex-dividend date: Jul-16-2025
Risk Adjusted Returns v/s
Returns Beta

News
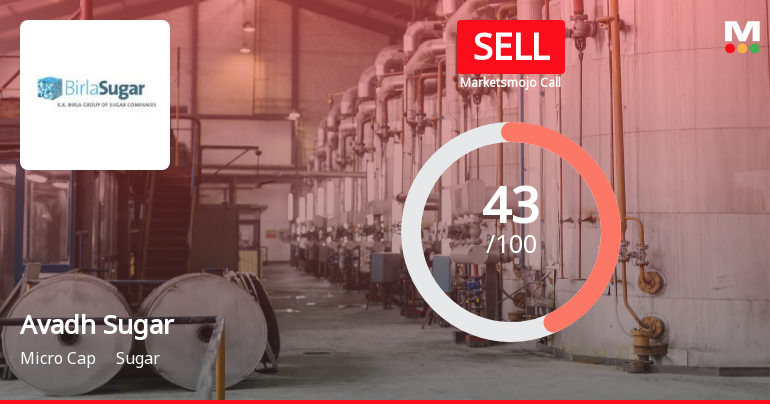
Avadh Sugar & Energy Ltd Downgraded to Sell Amid Weak Financials and Quality Concerns
Avadh Sugar & Energy Ltd has seen its investment rating downgraded from Hold to Sell following a comprehensive reassessment of its financial performance, quality metrics, valuation, and technical indicators. The downgrade reflects deteriorating fundamentals, rising debt concerns, and a weakening market position amid challenging sector dynamics.
Read full news article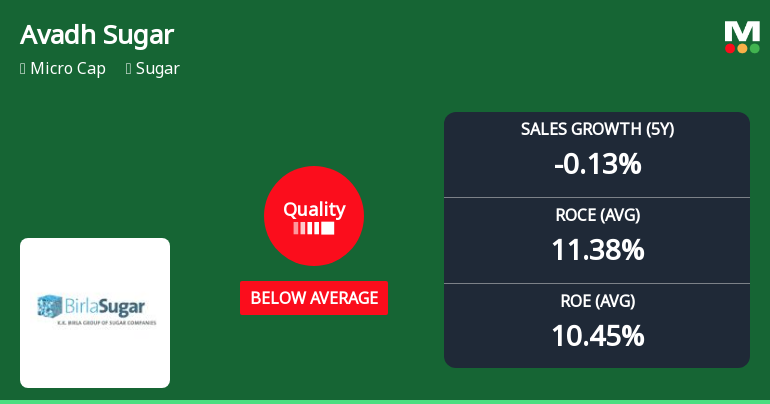
Avadh Sugar & Energy Ltd Downgraded to Sell as Quality Parameters Deteriorate
Avadh Sugar & Energy Ltd has seen a notable downgrade in its quality grading from average to below average, prompting a shift in its MarketsMOJO rating from Hold to Sell as of 13 May 2026. This change reflects a deterioration in key business fundamentals including profitability, leverage, and growth consistency, raising concerns for investors amid a challenging industry backdrop.
Read full news articleAre Avadh Sugar & Energy Ltd latest results good or bad?
Avadh Sugar & Energy Ltd's latest financial results for Q4 FY26 reflect a complex operational landscape characterized by both seasonal strengths and ongoing challenges. The company reported a net profit of ₹55.61 crores, which represents a significant sequential increase of 232.99% compared to the previous quarter. However, this figure is down 22.43% year-on-year from ₹71.68 crores in Q4 FY25, indicating a decline in profitability despite the seasonal boost typically seen in the sugar industry during the crushing season. Revenue for the quarter reached ₹670.61 crores, showing a modest sequential growth of 5.09% from ₹638.15 crores in Q3 FY26. Nevertheless, this revenue figure reflects a slight year-on-year decline of 1.20% compared to ₹678.78 crores in the same quarter last year, highlighting the company's struggle to achieve consistent top-line growth amidst a challenging market environment. Operating ma...
Read full news article Announcements
Change in Director(s)
03-Sep-2019 | Source : NSE
| Avadh Sugar & Energy Limited has informed the Exchange regarding Change in Director(s) of the company. |
Shareholders meeting
02-Sep-2019 | Source : NSE
| Avadh Sugar & Energy Limited has submitted the Exchange a copy Srutinizers report of Annual General Meeting held on September 02, 2019. Further, the company has informed the Exchange regarding voting results. |
Investor Presentation
16-Aug-2019 | Source : NSE
| Avadh Sugar & Energy Limited has informed the Exchange regarding Investor Presentation |
Corporate Actions

No Upcoming Board Meetings

Avadh Sugar & Energy Ltd has declared 100% dividend, ex-date: 16 Jul 25

No Splits history available

Avadh Sugar & Energy Ltd has announced 1:1 bonus issue, ex-date: 27 Jun 19

No Rights history available
Quality key factors
Valuation key factors
Technicals key factors
 Technical Indicator Scale: Bearish, Mildly Bearish, Sideways, Mildly Bullish, Bullish Turned
 Shareholding Snapshot : Mar 2026
Shareholding Compare (%holding)
Promoters
None
Held by 4 Schemes (0.01%)
Held by 27 FIIs (1.76%)
New India Retailing And Investment Ltd (9.72%)
Anil Kumar Goel (5.53%)
27.08%
Quarterly Results Snapshot (Standalone) - Mar'26 - YoY

YoY Growth in quarter ended Mar 2026 is -1.20% vs 9.52% in Mar 2025
YoY Growth in quarter ended Mar 2026 is -22.42% vs 29.64% in Mar 2025
Half Yearly Results Snapshot (Standalone) - Sep'25

Growth in half year ended Sep 2025 is 3.34% vs -9.43% in Sep 2024
Growth in half year ended Sep 2025 is -257.56% vs -81.35% in Sep 2024
Nine Monthly Results Snapshot (Standalone) - Dec'25
YoY Growth in nine months ended Dec 2025 is 3.38% vs -5.64% in Dec 2024
YoY Growth in nine months ended Dec 2025 is -89.54% vs -77.67% in Dec 2024
Annual Results Snapshot (Standalone) - Mar'26
YoY Growth in year ended Mar 2026 is 2.20% vs -2.15% in Mar 2025
YoY Growth in year ended Mar 2026 is -34.83% vs -31.36% in Mar 2025
About Avadh Sugar & Energy Ltd

Company Coordinates


