
Dashboard
Poor Management Efficiency with a low ROCE of 9.59%
- The company has been able to generate a Return on Capital Employed (avg) of 9.59% signifying low profitability per unit of total capital (equity and debt)
- PBT LESS OI(Q) At Rs -63.40 cr has Fallen at -1194.99%
- PAT(Q) At Rs -32.86 cr has Fallen at -271.1%
- OPERATING PROFIT TO INTEREST (Q) Lowest at 1.19 times
With ROCE of 10.1, it has a Expensive valuation with a 4.6 Enterprise value to Capital Employed
Stock DNA
Electronics & Appliances
INR 23,226 Cr (Small Cap)
105.00
58
0.00%
0.50
6.11%
6.41
Total Returns (Price + Dividend) 
Latest dividend: 1.6 per share ex-dividend date: Mar-26-2020
Risk Adjusted Returns v/s
Returns Beta

News

Amber Enterprises India: Analytical Perspective Shift Amid Mixed Financial and Technical Signals
Amber Enterprises India, a key player in the Electronics & Appliances sector, has experienced a revision in its market assessment following a detailed analysis of its quality, valuation, financial trends, and technical indicators. This article explores the factors influencing the recent changes in the company’s evaluation metrics, providing investors with a comprehensive understanding of its current standing.
Read More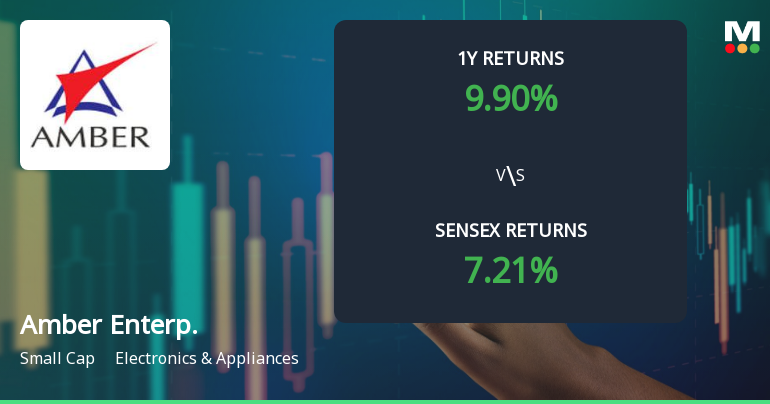
Amber Enterprises India: Technical Momentum Shifts Amid Mixed Market Signals
Amber Enterprises India has experienced a notable shift in its technical momentum, reflecting a complex interplay of bullish and bearish indicators across multiple timeframes. The stock’s recent price movements and technical signals suggest a transition from a mildly bearish trend to a sideways pattern, prompting investors to closely monitor key momentum indicators such as MACD, RSI, and moving averages for clearer directional cues.
Read More
Amber Enterprises India: Analytical Revision Reflects Mixed Signals Across Key Financial and Technical Parameters
Amber Enterprises India has undergone a revision in its evaluation metrics, reflecting a nuanced market assessment influenced by shifts in technical trends, valuation considerations, financial performance, and quality indicators. This article analyses the factors shaping the current perspective on the stock within the Electronics & Appliances sector.
Read More Announcements
Amber Enterprises India Limited - Other General Purpose
05-Dec-2019 | Source : NSEAmber Enterprises India Limited has informed the Exchange regarding Disclosure of Related Party Transactions for the half year ended September 30, 2019 pursuant to Regulation 23(9) of SEBI ( LODR) Regulations, 2015.
Amber Enterprises India Limited - Record Date
08-Nov-2019 | Source : NSEAmber Enterprises India Limited has informed the Exchange that the Company has fixed Record Date as November 20, 2019 for the purpose of payment of Interim dividend
Amber Enterprises India Limited - Analysts/Institutional Investor Meet/Con. Call Updates
31-Oct-2019 | Source : NSEAmber Enterprises India Limited has informed the Exchange regarding Analysts/Institutional Investor Meet/Con. Call Updates
Corporate Actions

No Upcoming Board Meetings

Amber Enterprises India Ltd has declared 16% dividend, ex-date: 26 Mar 20

No Splits history available

No Bonus history available

No Rights history available
Quality key factors
Valuation key factors
Technicals key factors
 Technical Indicator Scale: Bearish, Mildly Bearish, Sideways, Mildly Bullish, Bullish Turned
 Shareholding Snapshot : Sep 2025
Shareholding Compare (%holding)
Promoters
None
Held by 30 Schemes (15.59%)
Held by 323 FIIs (30.6%)
Jasbir Singh (20.08%)
Motilal Oswal Focused Fund (2.74%)
9.38%
Quarterly Results Snapshot (Consolidated) - Sep'25 - YoY

YoY Growth in quarter ended Sep 2025 is -2.24% vs 81.73% in Sep 2024
YoY Growth in quarter ended Sep 2025 is -271.15% vs 376.26% in Sep 2024
Half Yearly Results Snapshot (Consolidated) - Sep'25
Growth in half year ended Sep 2025 is 24.72% vs 55.42% in Sep 2024
Growth in half year ended Sep 2025 is -22.42% vs 136.57% in Sep 2024
Nine Monthly Results Snapshot (Consolidated) - Dec'24

YoY Growth in nine months ended Dec 2024 is 58.50% vs -0.02% in Dec 2023
YoY Growth in nine months ended Dec 2024 is 233.42% vs -28.20% in Dec 2023
Annual Results Snapshot (Consolidated) - Mar'25
YoY Growth in year ended Mar 2025 is 48.20% vs -2.86% in Mar 2024
YoY Growth in year ended Mar 2025 is 83.16% vs -15.47% in Mar 2024
About Amber Enterprises India Ltd

Company Coordinates


