
Compare Amber Enterp. with Similar Stocks
Stock DNA
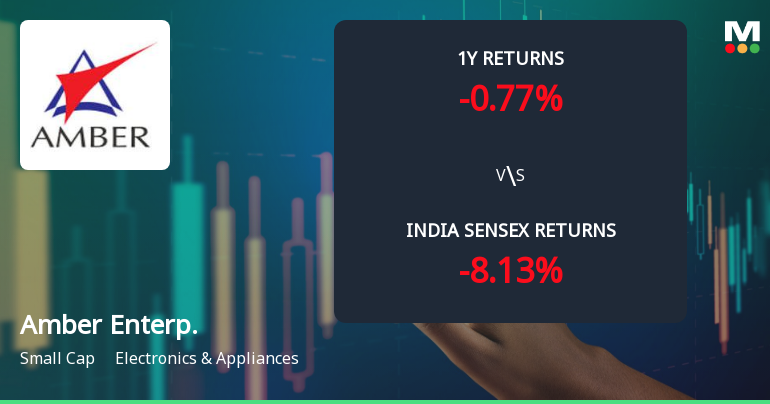
Electronics & Appliances
INR 27,731 Cr (Small Cap)
120.00
60
0.00%
0.51
5.30%
6.27
Total Returns (Price + Dividend) 
Latest dividend: 1.5896078747781182 per share ex-dividend date: Mar-26-2020
Risk Adjusted Returns v/s
Returns Beta

News
Amber Enterprises India Ltd Technical Momentum Shifts Amid Mixed Market Signals
Amber Enterprises India Ltd has exhibited a subtle shift in its technical momentum, moving from a mildly bearish stance to a mildly bullish trend on daily moving averages, despite lingering bearish signals on weekly and monthly MACD and KST indicators. This nuanced technical landscape, combined with a recent 2.23% day gain and a strong year-to-date return of 18.99%, presents a complex picture for investors navigating the electronics and appliances sector.
Read full news article
Amber Enterprises India Ltd Downgraded to Strong Sell Amid Technical and Financial Weakness
Amber Enterprises India Ltd has been downgraded from a Sell to a Strong Sell rating as of 8 July 2026, reflecting deteriorating fundamentals and a shift in technical indicators. The downgrade is driven by a combination of weakening financial performance, expensive valuation metrics, and a bearish technical outlook, signalling caution for investors in this small-cap electronics and appliances company.
Read full news article
Amber Enterprises India Ltd Technical Momentum Shifts Amid Mixed Market Signals
Amber Enterprises India Ltd, a small-cap player in the Electronics & Appliances sector, has experienced a subtle but notable shift in its technical momentum, moving from a mildly bullish to a mildly bearish trend. This transition is underscored by a combination of technical indicators including MACD, RSI, moving averages, and Bollinger Bands, signalling caution for investors amid recent price declines and mixed market signals.
Read full news article Announcements
Amber Enterprises India Limited - Other General Purpose
05-Dec-2019 | Source : NSEAmber Enterprises India Limited has informed the Exchange regarding Disclosure of Related Party Transactions for the half year ended September 30, 2019 pursuant to Regulation 23(9) of SEBI ( LODR) Regulations, 2015.
Amber Enterprises India Limited - Record Date
08-Nov-2019 | Source : NSEAmber Enterprises India Limited has informed the Exchange that the Company has fixed Record Date as November 20, 2019 for the purpose of payment of Interim dividend
Amber Enterprises India Limited - Analysts/Institutional Investor Meet/Con. Call Updates
31-Oct-2019 | Source : NSEAmber Enterprises India Limited has informed the Exchange regarding Analysts/Institutional Investor Meet/Con. Call Updates
Corporate Actions

No Upcoming Board Meetings

Amber Enterprises India Ltd has declared 16% dividend, ex-date: 26 Mar 20

No Splits history available

No Bonus history available

No Rights history available
Quality key factors
Valuation key factors
Technicals key factors
 Technical Indicator Scale: Bearish, Mildly Bearish, Sideways, Mildly Bullish, Bullish Turned
 Shareholding Snapshot : Mar 2026
Shareholding Compare (%holding)
Promoters
None
Held by 32 Schemes (21.66%)
Held by 261 FIIs (23.96%)
Jasbir Singh (20.06%)
Invesco India Midcap Fund (4.69%)
8.56%
Quarterly Results Snapshot (Consolidated) - Mar'26 - YoY

YoY Growth in quarter ended Mar 2026 is 10.49% vs 33.80% in Mar 2025
YoY Growth in quarter ended Mar 2026 is 15.34% vs 22.60% in Mar 2025
Half Yearly Results Snapshot (Consolidated) - Sep'25
Growth in half year ended Sep 2025 is 24.72% vs 55.42% in Sep 2024
Growth in half year ended Sep 2025 is -22.42% vs 136.57% in Sep 2024
Nine Monthly Results Snapshot (Consolidated) - Dec'25
YoY Growth in nine months ended Dec 2025 is 29.26% vs 58.50% in Dec 2024
YoY Growth in nine months ended Dec 2025 is -65.64% vs 233.42% in Dec 2024
Annual Results Snapshot (Consolidated) - Mar'26
YoY Growth in year ended Mar 2026 is 22.19% vs 48.20% in Mar 2025
YoY Growth in year ended Mar 2026 is -27.06% vs 83.29% in Mar 2025
About Amber Enterprises India Ltd

Company Coordinates


