
Compare Voltas with Similar Stocks
Stock DNA
Electronics & Appliances
INR 45,232 Cr (Mid Cap)
115.00
89
0.30%
-0.01
6.20%
7.02
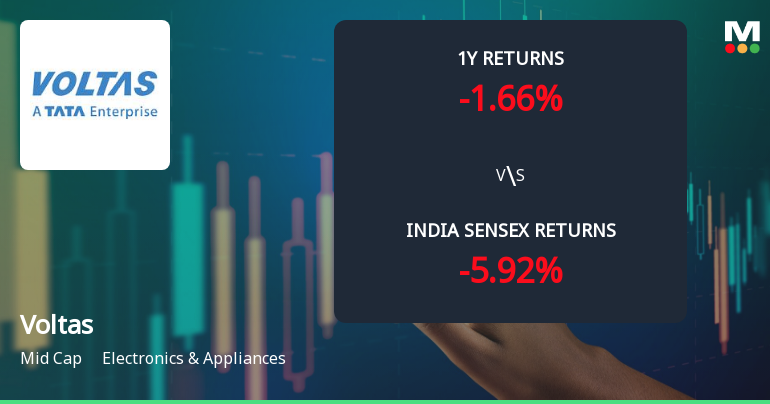
Total Returns (Price + Dividend) 
Latest dividend: 4.009670878178131 per share ex-dividend date: Jun-12-2026
Risk Adjusted Returns v/s
Returns Beta

News
Voltas Ltd. Technical Momentum Shifts Amid Mixed Indicator Signals
Voltas Ltd., a mid-cap player in the Electronics & Appliances sector, has exhibited a notable shift in its technical momentum, reflecting a complex interplay of bullish and bearish signals across key indicators. Despite a recent 4.81% surge in daily price, the company’s overall technical outlook remains cautiously mild bearish, underscoring the nuanced market sentiment surrounding the stock as of 14 Jul 2026.
Read full news article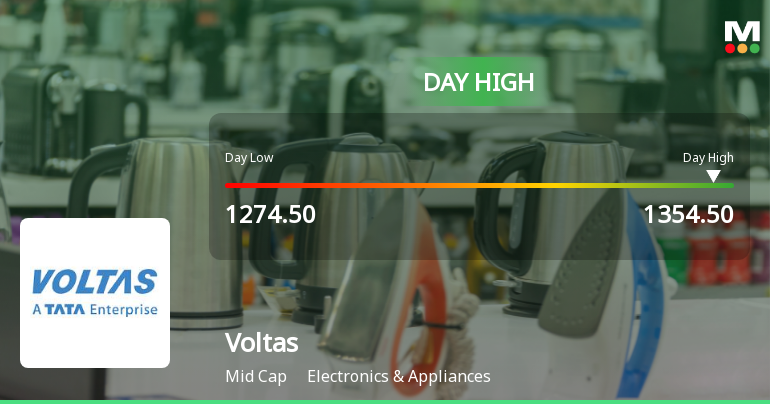
Voltas Ltd. Rallies 5.02% and Approaches 100 DMA Resistance — A Key Technical Test Ahead
The Sensex remained flat on 13 Jul 2026, while Voltas Ltd. surged 5.02% to touch an intraday high of Rs 1353.9, outperforming its sector by 1.45 percentage points. This sharp single-session gain stands out amid a mixed market backdrop and invites a closer look at whether this move signals a genuine breakout or a technical rebound.
Read full news article
Voltas Ltd. is Rated Strong Sell
Voltas Ltd. is rated Strong Sell by MarketsMOJO, with this rating last updated on 16 May 2026. However, the analysis and financial metrics discussed here reflect the stock's current position as of 11 July 2026, providing investors with an up-to-date view of the company’s performance and outlook.
Read full news article Announcements
Voltas Limited - Other General Purpose
27-Nov-2019 | Source : NSEVoltas Limited has informed the Exchange regarding Disclosure of Related party Transactions.
Analysts\/Institutional Investor Meet\/Con. Call Updates
16-Sep-2019 | Source : NSE
| Voltas Limited has informed the Exchange regarding Analysts/Institutional Investor Meet/Con. Call Updates |
Press Release
10-Sep-2019 | Source : NSE
| Voltas Limited has informed the Exchange regarding a press release dated September 10, 2019, titled "Voltas and Tata Power partner to promote Energy Efficient ACs for consumers in Mumbai.". |
Corporate Actions

No Upcoming Board Meetings

Voltas Ltd. has declared 400% dividend, ex-date: 12 Jun 26

Voltas Ltd. has announced 1:10 stock split, ex-date: 22 Sep 06

No Bonus history available

No Rights history available
Quality key factors
Valuation key factors
Technicals key factors
 Technical Indicator Scale: Bearish, Mildly Bearish, Sideways, Mildly Bullish, Bullish Turned
 Shareholding Snapshot : Mar 2026
Shareholding Compare (%holding)
Promoters
None
Held by 31 Schemes (14.7%)
Held by 539 FIIs (18.45%)
Tata Sons Private Limited (26.64%)
Life Insurance Corporation Of India (7.97%)
10.15%
Quarterly Results Snapshot (Consolidated) - Mar'26 - QoQ

QoQ Growth in quarter ended Mar 2026 is 59.17% vs 30.82% in Dec 2025

QoQ Growth in quarter ended Mar 2026 is 36.76% vs 147.74% in Dec 2025
Half Yearly Results Snapshot (Consolidated) - Sep'25
Growth in half year ended Sep 2025 is -16.63% vs 33.39% in Sep 2024
Growth in half year ended Sep 2025 is -62.68% vs 182.11% in Sep 2024
Nine Monthly Results Snapshot (Consolidated) - Dec'25
YoY Growth in nine months ended Dec 2025 is -12.10% vs 28.59% in Dec 2024
YoY Growth in nine months ended Dec 2025 is -56.74% vs 342.87% in Dec 2024
Annual Results Snapshot (Consolidated) - Mar'26
YoY Growth in year ended Mar 2026 is -7.58% vs 23.49% in Mar 2025
YoY Growth in year ended Mar 2026 is -55.33% vs 233.88% in Mar 2025
About Voltas Ltd.

Company Coordinates


