
Compare Aakash Explor. with Similar Stocks
Dashboard
Weak Long Term Fundamental Strength with a -4.32% CAGR growth in Operating Profits over the last 5 years
- The company has been able to generate a Return on Equity (avg) of 7.85% signifying low profitability per unit of shareholders funds
Flat results in Mar 26
Below par performance in long term as well as near term
Total Returns (Price + Dividend) 
Aakash Explor. for the last several years.
Risk Adjusted Returns v/s
Returns Beta

News
Aakash Exploration Services Ltd is Rated Sell
Aakash Exploration Services Ltd is rated 'Sell' by MarketsMOJO, with this rating last updated on 01 June 2026. However, the analysis and financial metrics discussed here reflect the stock's current position as of 16 June 2026, providing investors with the latest insights into its performance and outlook.
Read full news article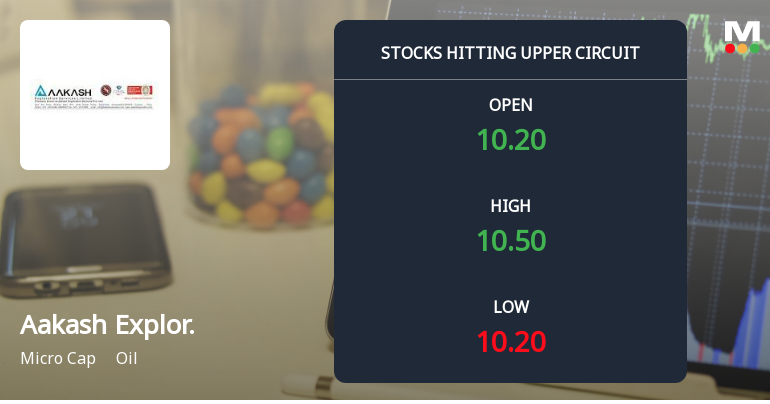
Aakash Exploration Services Ltd Locks at Upper Circuit With 4.00% Gain — Buyers Queue, Sellers Absent
At Rs 10.50, the buying was done — not because demand dried up, but because the exchange wouldn't let the stock go any higher. Aakash Exploration Services Ltd locked at its upper circuit of 5% on 12 Jun 2026, with buyers queuing and no sellers willing to part with shares.
Read full news article
Aakash Exploration Services Ltd is Rated Sell
Aakash Exploration Services Ltd is rated 'Sell' by MarketsMOJO, with this rating last updated on 01 June 2026. While the rating was revised on that date, the analysis and financial metrics discussed here reflect the stock's current position as of 08 June 2026, providing investors with an up-to-date perspective on the company’s performance and outlook.
Read full news article Announcements
Corporate Actions

No Upcoming Board Meetings

No Dividend history available

Aakash Exploration Services Ltd has announced 1:10 stock split, ex-date: 03 Feb 22

Aakash Exploration Services Ltd has announced 1:2 bonus issue, ex-date: 26 Mar 20

No Rights history available
Quality key factors
Valuation key factors
Technicals key factors
 Technical Indicator Scale: Bearish, Mildly Bearish, Sideways, Mildly Bullish, Bullish Turned
 Shareholding Snapshot : Mar 2026
Shareholding Compare (%holding)
Promoters
None
Held by 0 Schemes
Held by 0 FIIs
Vipul Navinchandra Haria (36.64%)
None
29.55%
Quarterly Results Snapshot (Standalone) - Mar'26 - QoQ

QoQ Growth in quarter ended Mar 2026 is 4.82% vs 25.55% in Dec 2025
QoQ Growth in quarter ended Mar 2026 is 135.00% vs 185.71% in Dec 2025
Half Yearly Results Snapshot (Standalone) - Sep'25
Growth in half year ended Sep 2025 is -0.82% vs 24.08% in Sep 2024

Growth in half year ended Sep 2025 is -37.40% vs -42.79% in Sep 2024
Nine Monthly Results Snapshot (Standalone) - Dec'25
YoY Growth in nine months ended Dec 2025 is 10.22% vs 18.05% in Dec 2024
YoY Growth in nine months ended Dec 2025 is 3.18% vs -41.85% in Dec 2024
Annual Results Snapshot (Standalone) - Mar'26
YoY Growth in year ended Mar 2026 is 14.53% vs 6.46% in Mar 2025
YoY Growth in year ended Mar 2026 is 90.22% vs -70.37% in Mar 2025
About Aakash Exploration Services Ltd

Company Coordinates


