
Compare Aakash Explor. with Similar Stocks
Dashboard
Weak Long Term Fundamental Strength with a -4.32% CAGR growth in Operating Profits over the last 5 years
- The company has been able to generate a Return on Equity (avg) of 7.85% signifying low profitability per unit of shareholders funds
Flat results in Mar 26
Below par performance in long term as well as near term
Total Returns (Price + Dividend) 
Aakash Explor. for the last several years.
Risk Adjusted Returns v/s
Returns Beta

News
Aakash Exploration Services Ltd is Rated Sell
Aakash Exploration Services Ltd is rated 'Sell' by MarketsMOJO, with this rating last updated on 30 June 2026. However, the analysis and financial metrics discussed here reflect the stock's current position as of 09 July 2026, providing investors with an up-to-date view of the company’s fundamentals, returns, and market standing.
Read full news article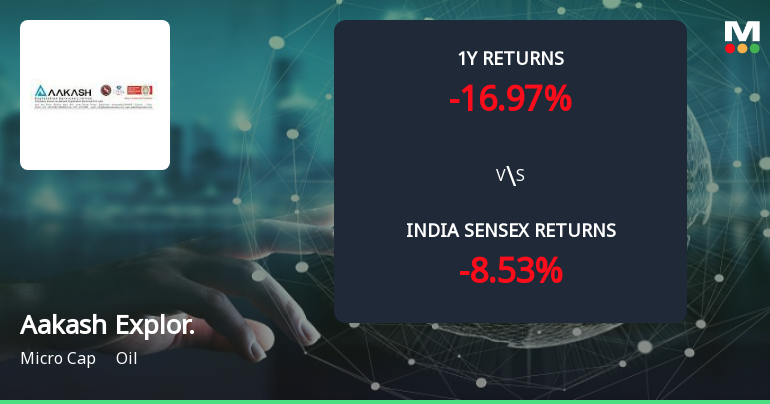
Golden Cross Forms in Aakash Exploration Services Ltd — On a Day the Stock Fell 1.15%. What the Mixed Signals Mean
The 50-day moving average has crossed above the 200-day moving average for Aakash Exploration Services Ltd, signalling a golden cross on 30 Jun 2026. Yet, the stock declined 1.15% on the same day, while monthly technical indicators remain bearish. This divergence between the moving averages and price action calls for a detailed examination of the signal’s reliability.
Read full news article
Aakash Exploration Services Ltd is Rated Strong Sell
Aakash Exploration Services Ltd is rated Strong Sell by MarketsMOJO. This rating was last updated on 25 June 2026, reflecting a reassessment of the stock’s outlook. However, all fundamentals, returns, and financial metrics discussed below are current as of 28 June 2026, providing investors with the latest perspective on the company’s position.
Read full news article Announcements
Corporate Actions

No Upcoming Board Meetings

No Dividend history available

Aakash Exploration Services Ltd has announced 1:10 stock split, ex-date: 03 Feb 22

Aakash Exploration Services Ltd has announced 1:2 bonus issue, ex-date: 26 Mar 20

No Rights history available
Quality key factors
Valuation key factors
Technicals key factors
 Technical Indicator Scale: Bearish, Mildly Bearish, Sideways, Mildly Bullish, Bullish Turned
 Shareholding Snapshot : Mar 2026
Shareholding Compare (%holding)
Promoters
None
Held by 0 Schemes
Held by 0 FIIs
Vipul Navinchandra Haria (36.64%)
None
29.55%
Quarterly Results Snapshot (Standalone) - Mar'26 - QoQ

QoQ Growth in quarter ended Mar 2026 is 4.82% vs 25.55% in Dec 2025
QoQ Growth in quarter ended Mar 2026 is 135.00% vs 185.71% in Dec 2025
Half Yearly Results Snapshot (Standalone) - Sep'25
Growth in half year ended Sep 2025 is -0.82% vs 24.08% in Sep 2024

Growth in half year ended Sep 2025 is -37.40% vs -42.79% in Sep 2024
Nine Monthly Results Snapshot (Standalone) - Dec'25
YoY Growth in nine months ended Dec 2025 is 10.22% vs 18.05% in Dec 2024
YoY Growth in nine months ended Dec 2025 is 3.18% vs -41.85% in Dec 2024
Annual Results Snapshot (Standalone) - Mar'26
YoY Growth in year ended Mar 2026 is 14.53% vs 6.46% in Mar 2025
YoY Growth in year ended Mar 2026 is 90.22% vs -70.37% in Mar 2025
About Aakash Exploration Services Ltd

Company Coordinates


