Spectrum Electr.

  • Market Cap: Small Cap
  • Industry: Other Electrical Equipment
  • ISIN: INE01EO01010
  • NSEID: SPECTRUM
  • BSEID: 544386
INR
2,144.50
37.9 (1.8%)
BSENSE

Aug 28, 10:46 AM

BSE+NSE Vol: 2.46 k

  • Price Points
  • Score
  • Mojo Parameters
  • Total Return
  • News and Corporate Actions
  • Key factors
  • Shareholding
  • Financials
  • CompanyCV
stock-summaryPrice Point
High/Low

1Day

52 Week

Valuation
Technical
Day's Volume

CASH

2.46 k (25.11%) Volume

Shareholding (Jun 2026)

FII

3.64%

Held by 3 FIIs

DII

0.36%

Held by 0 DIIs

Promoter

72.72%

Why is Spectrum Electrical Industries Ltd falling/rising?

28-Aug-2026

As of 27-Aug, the stock price of Spectrum Electrical Industries Ltd is currently at 2,109.80, reflecting a decline of 4.96%. The stock has underperformed its sector and the benchmark Sensex, indicating downward pressure despite healthy long-term growth metrics.

As of 27-Aug, the stock price of Spectrum Electrical Industries Ltd is falling, currently at 2,109.80, which reflects a decrease of 110.1 or 4.96%. This decline is evident in today's performance, where the stock has underperformed its sector by 6.84% and opened with a loss of 3.01%. Additionally, the stock has experienced a trend reversal, having fallen after two consecutive days of gains, and it touched an intraday low of Rs 2,109, marking a 5% decrease.<BR><BR>In the context of recent performance, the stock has seen a 4.95% decline over the past week, while the benchmark Sensex has only decreased by 0.78%. Over the past month, the stock has also underperformed, with a 4.05% decline compared to a slight increase of 0.13% in the Sensex. Furthermore, there is a notable decrease in investor participation, as the delivery volume on 26 August fell by 27.03% against the 5-day average, indicating reduced trading interest.<BR><BR>Despite these short-term challenges, it is important to note that the company has shown healthy long-term growth, with net sales increasing at an annual rate of 26.90% and operating profit at 35.75%. However, the current market dynamics and recent performance metrics suggest that the stock is facing downward pressure at this time.

View full answer

Should I buy, sell or hold Spectrum Electrical Industries Ltd?

16-Aug-2026

Who are in the management team of Spectrum Electr.?

14-Aug-2026

The management team of Spectrum Electr. includes Deepak Suresh Chaudhari (Managing Director), Bharti Deepak Chaudhari (Whole-time Director), and several directors, including independent directors and a company secretary, responsible for the company's strategic direction and governance.

The management team of Spectrum Electr. includes the following individuals:<BR><BR>1. **Deepak Suresh Chaudhari** - Managing Director<BR>2. **Bharti Deepak Chaudhari** - Whole-time Director<BR>3. **Chandrakant Bhaskar Rane** - Director<BR>4. **Devendra Sudhakar Rane** - Director<BR>5. **Sanjay Padmakar Pawde** - Independent Director<BR>6. **Narendra Daulatrao Wagh** - Independent Director<BR>7. **Saurabh Shrikant Malpani** - Independent Director<BR>8. **Sarita Zamwar** - Company Secretary<BR>9. **Kishor Dalu Dhake** - Additional Independent Director<BR><BR>This team is responsible for the strategic direction and governance of the company.

View full answer

What does Spectrum Electr. do?

14-Aug-2026

Spectrum Electrical Industries Ltd operates in the Other Electrical Equipment industry, with a market cap of INR 3,520 Cr and reported net sales of 283 Cr and net profit of 27 Cr for March 2026. The company has a P/E ratio of 72.00 and a debt-equity ratio of 0.76.

Overview: <BR>Spectrum Electrical Industries Ltd operates in the Other Electrical Equipment industry and is categorized as a Small Cap company.<BR><BR>History: <BR>The company was originally incorporated as Spectrum Polytech Private Limited in 2008. It underwent several name changes, becoming Spectrum Electrical Component Private Limited in 2014 and later Spectrum Electrical Industries Private Limited in 2018. The latest quarterly results reported net sales and net profit for March 2026.<BR><BR>Financial Snapshot: <BR>Net Sales: 283 Cr (Quarterly Results - Mar 2026) <BR>Net Profit: 27 Cr (Quarterly Results - Mar 2026) <BR>Market Cap: INR 3,520 Cr (Small Cap)<BR><BR>Key Metrics: <BR>P/E: 72.00 <BR>Industry P/E: 56 <BR>Dividend Yield: 0.00% <BR>Debt-Equity: 0.76 <BR>Return on Equity: 17.74% <BR>Price to Book: 14.87 <BR><BR>Contact Details: <BR>Address: Plot No. V -195, Midc Area, Ajanta Road, Jalgaon Maharashtra : 425003 <BR>Tel: 02-57 2210 192 <BR>Website: www.spectrum-india.com

View full answer

Who are the peers of the Spectrum Electr.?

14-Aug-2026

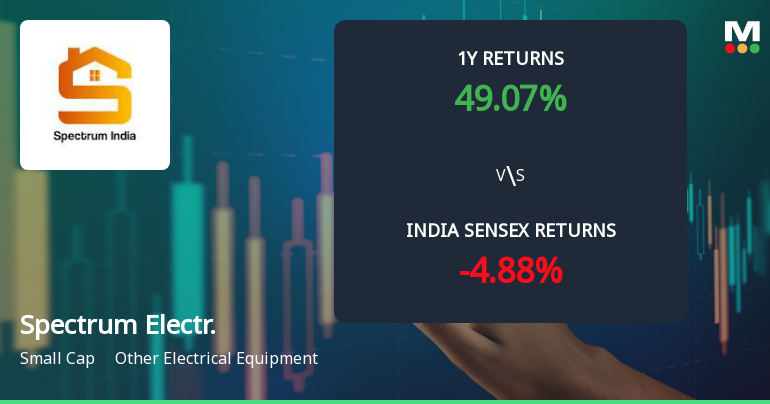
Spectrum Electr.'s peers include Vikram Solar, Shilchar Tech., Ram Ratna Wires, Websol Energy, Yash Highvoltage, Bharat Bijlee, Rishabh Instrum., and HPL Electric, with varying management risks, growth rates, and capital structures. Rishabh Instrum. leads in 1-year returns at 121.10%, while Spectrum Electr. has a return of 53.33%.

Peers: The peers of Spectrum Electr. are Vikram Solar, Shilchar Tech., Ram Ratna Wires, Websol Energy, Yash Highvoltage, Bharat Bijlee, Rishabh Instrum., and HPL Electric.<BR><BR>Quality Snapshot: Excellent management risk is observed at Shilchar Tech. and Yash Highvoltage, while Average management risk is found at Vikram Solar, Ram Ratna Wires, Websol Energy, Spectrum Electr., Bharat Bijlee, and HPL Electric, and Below Average management risk is noted at Rishabh Instrum. Growth is Excellent for Vikram Solar, Shilchar Tech., Ram Ratna Wires, Websol Energy, and Yash Highvoltage, while Spectrum Electr. and Bharat Bijlee show Good growth, and Rishabh Instrum. has Below Average growth. Capital Structure is Excellent for Shilchar Tech. and Yash Highvoltage, Good for Vikram Solar and Websol Energy, Average for Ram Ratna Wires and Spectrum Electr., and Below Average for HPL Electric, while Bharat Bijlee and Rishabh Instrum. have Excellent capital structures.<BR><BR>Return Snapshot: Rishabh Instrum. has the highest 1-year return at 121.10%, while Bharat Bijlee has the lowest at -18.47%. Spectrum Electr.'s 1-year return of 53.33% is significantly higher than Bharat Bijlee's but lower than Rishabh Instrum.'s. Additionally, HPL Electric is the only peer with a negative six-month return at -10.00%.

View full answer

How big is Spectrum Electr.?

14-Aug-2026

As of 14th August, Spectrum Electrical Industries Ltd has a market capitalization of 3,474.00 Cr and reported net sales of 595.06 Cr and net profit of 51.76 Cr over the latest four quarters.

As of 14th August, <BR><BR>Market Cap: Spectrum Electrical Industries Ltd has a market capitalization of 3,474.00 Cr, categorizing it as a Small Cap company.<BR><BR>Recent Quarterly Performance: The sum of Net Sales for the latest 4 quarters is 595.06 Cr, while the sum of Net Profit for the same period is 51.76 Cr.<BR><BR>Balance Sheet Snapshot: The reporting period for the balance sheet is March 2025. Shareholder's Funds are valued at 190.56 Cr, and Total Assets amount to 445.00 Cr.

View full answer

Are Spectrum Electrical Industries Ltd latest results good or bad?

28-May-2026

Spectrum Electrical Industries Ltd reported strong Q4 FY26 results, with a net profit of ₹26.55 crore, up 162.35% QoQ and 95.51% YoY, and revenue growth of 125.80% QoQ. While operational performance is impressive, the high price-to-earnings ratio raises concerns about future valuation.

Spectrum Electrical Industries Ltd has reported exceptionally strong results for Q4 FY26, indicating a very positive performance. The company achieved a net profit of ₹26.55 crore, marking a remarkable increase of 162.35% quarter-on-quarter (QoQ) and 95.51% year-on-year (YoY). Revenue also saw significant growth, reaching ₹282.95 crore, which is a 125.80% increase QoQ and 67.88% YoY. <BR><BR>The operating margin improved to 16.09%, the highest quarterly margin recorded by the company, reflecting enhanced operational efficiency and effective cost management. Additionally, the profit after tax margin rose to 9.35%, up from 8.15% in the previous quarter.<BR><BR>Overall, these results demonstrate strong execution and a robust growth trajectory, positioning Spectrum Electrical Industries favorably within the electrical equipment sector. However, while the operational performance is commendable, the company's valuation remains a concern, trading at a high price-to-earnings ratio, which may limit future upside potential.

View full answer

When is the next results date for Spectrum Electrical Industries Ltd?

21-May-2026

The next results date for Spectrum Electrical Industries Ltd is 26 May 2026.

The next results date for Spectrum Electrical Industries Ltd is scheduled for 26 May 2026.

View full answer

Is Spectrum Electr. technically bullish or bearish?

03-Dec-2025

As of December 2, 2025, the market trend has shifted to mildly bearish, influenced by bearish signals from Bollinger Bands and Dow Theory, despite some mild bullishness from the weekly MACD and a lack of momentum indicated by the RSI.

As of 2 December 2025, the technical trend has changed from sideways to mildly bearish. The current stance is bearish, driven primarily by the weekly MACD indicating mild bullishness but overshadowed by bearish signals from the Bollinger Bands and Dow Theory. The recent price action shows a significant drop from the previous close, and the RSI shows no signal, indicating a lack of momentum. Overall, the indicators suggest a bearish outlook with weak strength.

View full answer

How has been the historical performance of Spectrum Electr.?

17-Nov-2025

Spectrum Electr. has shown consistent growth in net sales and profits, with net sales increasing from 142.30 Cr in Mar'20 to 402.24 Cr in Mar'25, and profit after tax rising from 4.68 Cr to 25.42 Cr in the same period. The company's total assets also grew significantly, indicating a strong upward trajectory in financial performance.

Answer:<BR>The historical performance of Spectrum Electr. shows a consistent growth trend in net sales and profits over the years.<BR><BR>Breakdown:<BR>Spectrum Electr. has demonstrated significant growth in net sales, increasing from 142.30 Cr in Mar'20 to 402.24 Cr in Mar'25. The total operating income followed a similar trajectory, reaching 402.24 Cr in Mar'25, up from 258.29 Cr in Mar'23. The raw material costs also rose, reflecting the increased sales, climbing from 95.03 Cr in Mar'20 to 281.38 Cr in Mar'25. Operating profit, excluding other income, improved from 15.82 Cr in Mar'20 to 53.83 Cr in Mar'25, while profit before tax surged from 6.48 Cr in Mar'20 to 35.87 Cr in Mar'25. Consequently, profit after tax rose from 4.68 Cr in Mar'20 to 25.42 Cr in Mar'25, indicating a robust growth in profitability. The company's total assets increased from 143.30 Cr in Mar'19 to 317.25 Cr in Mar'24, with total liabilities also rising but at a slower pace, from 88.74 Cr in Mar'24. Cash flow from financing activities showed a positive trend, with a net cash inflow of 3.00 Cr in Mar'24, up from 6.00 Cr in Mar'23. Overall, Spectrum Electr. has shown a strong upward trajectory in its financial performance over the years.

View full answer

Who are the top shareholders of the Spectrum Electr.?

17-Jul-2025

The top shareholders of Spectrum Electr. are Deepak Suresh Chaudhari with 52.85%, Sunil Pralhad Jangle as the highest public shareholder at 4.85%, and individual investors holding 13.91%. Additionally, four foreign institutional investors own a combined 3.67%, with no mutual funds involved.

The top shareholders of Spectrum Electr. include Deepak Suresh Chaudhari, who holds the largest stake at 52.85%. Other significant shareholders include Sunil Pralhad Jangle, the highest public shareholder, with a holding of 4.85%. Additionally, individual investors collectively own 13.91% of the company. The company also has four foreign institutional investors (FIIs) that hold a combined 3.67%, while there are currently no mutual funds involved.

View full answer

Is Spectrum Electr. overvalued or undervalued?

09-Jun-2025

As of June 2, 2025, Spectrum Electrical Industries Ltd. is considered very expensive and overvalued due to its high PE ratio of 94.10, EV to EBITDA of 49.67, and PEG ratio of 2.26, which are significantly higher than its peers, coupled with recent underperformance compared to the Sensex.

As of 2 June 2025, the valuation grade for Spectrum Electrical Industries Ltd. has moved from does not qualify to very expensive. The company is currently overvalued based on its high valuation metrics, including a PE ratio of 94.10, an EV to EBITDA of 49.67, and a PEG ratio of 2.26. These figures indicate that the stock is trading at a premium compared to its earnings growth potential.<BR><BR>In comparison to its peers, Spectrum's valuation appears significantly higher, with its PE ratio exceeding that of similar companies in the industry. For instance, while Spectrum has a PE of 94.10, other comparable firms have lower ratios, suggesting that investors are paying much more for each unit of earnings. Additionally, the company's recent stock performance has lagged behind the Sensex, with a 1-week return of -2.87% compared to the Sensex's 1.36% gain. Overall, the combination of high valuation ratios and underperformance relative to the market reinforces the conclusion that Spectrum Electrical is overvalued.

View full answer

Has Spectrum Electr. declared dividend?

30-Apr-2025

Yes, Spectrum Electrical Industries Ltd has declared a 10% dividend, with an ex-date of May 26, 2023. Total returns data is not available for a comprehensive performance assessment.

Yes, Spectrum Electrical Industries Ltd has declared a dividend.<BR><BR>Dividend Details:<BR>- Percentage announced: 10%<BR>- Ex-date: 26 May 23<BR><BR>Dividend Yield: Not found or marked as empty.<BR><BR>Total Returns by Period:<BR>The total return for the first period reflects a combination of price return and dividend return, resulting in a significant overall return.<BR><BR>In the second period, the total return showcases the impact of both price appreciation and dividends, contributing positively to the overall performance.<BR><BR>Overall, Spectrum Electrical Industries Ltd has declared a dividend, indicating a commitment to returning value to shareholders. However, the total returns data is not available, which limits a comprehensive assessment of the company's performance.

View full answer
iScoreScore
Click here to find our call on this stock
Strong Sell
Sell
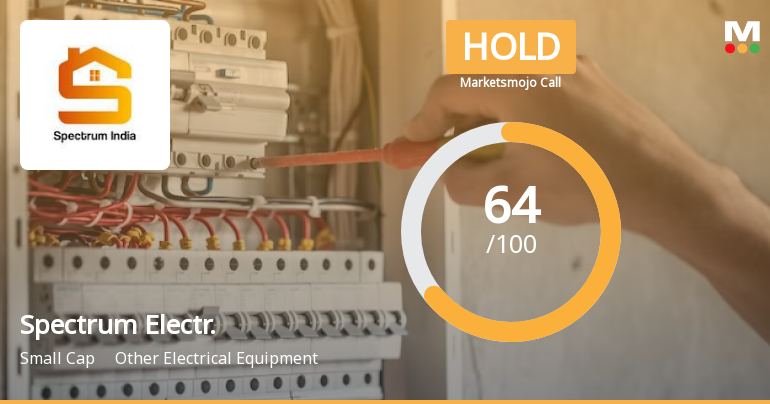
Hold
Buy
Strong Buy

Dashboard

1

Healthy long term growth as Net Sales has grown by an annual rate of 26.90% and Operating profit at 35.75%

 
2

The company has declared Positive results for the last 4 consecutive quarters

3

With ROCE of 14.7, it has a Very Expensive valuation with a 7.7 Enterprise value to Capital Employed

4

Falling Participation by Institutional Investors

5

Market Beating performance in long term as well as near term

stock-summaryMojo Parameters

Mojo Parameters

Loading Valuation Snapshot...

Stock DNA

stock-summary
Industry

Other Electrical Equipment

stock-summary
Market cap

INR 3,268 Cr (Small Cap)

stock-summary
P/E

64.00

stock-summary
Industry P/E

56

stock-summary
Dividend Yield

0.00%

stock-summary
Debt Equity

0.88

stock-summary
Return on Equity

18.18%

stock-summary
Price to Book

13.56

Revenue and Profits:
Net Sales:
155 Cr
(Quarterly Results - Jun 2026)
Net Profit:
13 Cr
stock-summaryTotal Returns
Total Returns (Price + Dividend) stock-summary
Dividend Yield (0%)
TimePeriod
Price Return
Dividend Return
Total Return
3 Months
47.79%
0%
47.79%
6 Months
47.95%
0%
47.95%
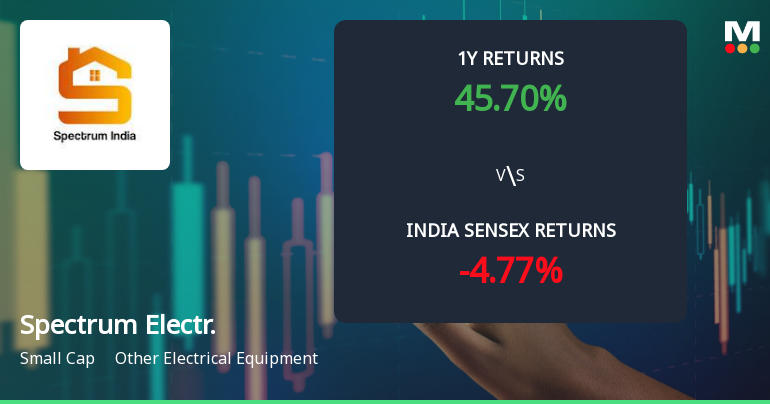
1 Year
42.84%
0%
42.84%
2 Years
20.44%
0%
20.44%
3 Years
128.02%
0%
128.02%
4 Years
3474.17%
1.59%
3475.76%
5 Years
3799.09%
1.79%
3800.88%

Latest dividend: 1 per share ex-dividend date: May-26-2023

Risk Adjusted Returns v/s stock-summary
Returns Beta
Icon
Beta has not been calculated since enough price history is not available
stock-summaryNews & Corporate Actions

News

Announcements stock-summary

Spectrum Electrical Industries Limited - Limited Review Report

22-Oct-2019 | Source : NSE

Spectrum Electrical Industries Limited has informed the Exchange regarding Limited Review Report for the Quarter ended September 30, 2019

Spectrum Electrical Industries Limited - Updates

17-Oct-2019 | Source : NSE

Spectrum Electrical Industries Limited has informed the Exchange regarding '"Spectrum Electrical Industries Limited has been intimated regarding incorporation of Wholly Owned Subsidiary of the Company."'.

Corporate Actions stock-summary

stock-summary
BOARD MEETING

No Upcoming Board Meetings

stock-summary
DIVIDEND

Spectrum Electrical Industries Ltd has declared 10% dividend, ex-date: 26 May 23

stock-summary
SPLITS

No Splits history available

stock-summary
BONUS

No Bonus history available

stock-summary
RIGHTS

No Rights history available

stock-summaryKey Factors

Quality key factors stock-summary

Factor
Value
Sales Growth (5y)
26.90%
EBIT Growth (5y)
35.75%
EBIT to Interest (avg)
4.17
Debt to EBITDA (avg)
2.70
Net Debt to Equity (avg)
0.88
Sales to Capital Employed (avg)
1.25
Tax Ratio
25.19%
Dividend Payout Ratio
0
Pledged Shares
0
Institutional Holding
3.99%
ROCE (avg)
13.91%
ROE (avg)
18.18%

Valuation key factors

Factor
Value
P/E Ratio
64
Industry P/E
56
Price to Book Value
13.56
EV to EBIT
44.34
EV to EBITDA
38.28
EV to Capital Employed
7.67
EV to Sales
5.93
PEG Ratio
0.85
Dividend Yield
NA
ROCE (Latest)
14.68%
ROE (Latest)
18.18%

Technicals key factors

Indicator
Weekly
Monthly
MACD
Bullish
RSI
No Signal
No Signal
Bollinger Bands
Mildly Bullish
Moving Averages
Mildly Bullish (Daily)
KST
Bullish
Dow Theory
Mildly Bearish
Bullish
OBV
No Trend
Bullish
stock-summary Technical Indicator Scale: Bearish, Mildly Bearish, Sideways, Mildly Bullish, Bullish  Turned 
stock-summaryShareholding
Shareholding Snapshot : Jun 2026stock-summary
Shareholding Compare (%holding) stock-summary
Majority shareholders

Promoters

Pledged Promoter Holdings

None

Mutual Funds

Held by 0 Schemes

FIIs

Held by 3 FIIs (3.64%)

Promoter with highest holding

Deepak Suresh Chaudhari (53.05%)

Highest Public shareholder

Sunil Pralhad Jangle (4.82%)

Individual Investors Holdings

13.57%

stock-summaryFinancial
[
  {
    "link": "quarterly",
    "btn_text": "All Quarterly Results",
    "header": "Quarterly Results Snapshot (Consolidated) - Jun'26 - QoQ",
    "rhs": [
      {
        "prefix": "Net Sales ",
        "suffix": "QoQ Growth in quarter ended Jun 2026 is -21.75% vs 57.63% in Mar 2026",
        "dir": -1
      },
      {
        "prefix": "Consolidated Net Profit ",
        "suffix": "QoQ Growth in quarter ended Jun 2026 is -37.54% vs 106.13% in Mar 2026",
        "dir": -1
      }
    ],
    "table": {
      "header": [
        "Jun'26",
        "Mar'26",
        "Change(%)"
      ],
      "body": [
        {
          "field": "Net Sales",
          "val1": "154.55",
          "val2": "197.52",
          "chgp": "-21.75%",
          "chgp_class": "negative"
        },
        {
          "field": "Operating Profit (PBDIT) excl Other Income",
          "val1": "24.24",
          "val2": "33.80",
          "chgp": "-28.28%",
          "chgp_class": "negative"
        },
        {
          "field": "Interest",
          "val1": "5.22",
          "val2": "2.79",
          "chgp": "87.10%",
          "chgp_class": "negative"
        },
        {
          "field": "Exceptional Items",
          "val1": "0.00",
          "val2": "0.00",
          "chgp": "",
          "chgp_class": "neutral"
        },
        {
          "field": "Consolidate Net Profit",
          "val1": "13.03",
          "val2": "20.86",
          "chgp": "-37.54%",
          "chgp_class": "negative"
        },
        {
          "field": "Operating Profit Margin (Excl OI)",
          "val1": "15.68%",
          "val2": "17.11%",
          "chgp": "-1.43%",
          "chgp_class": "negative"
        }
      ]
    }
  },
  {
    "link": "half-yearly",
    "btn_text": "All Half Yearly Results",
    "header": "Half Yearly Results Snapshot (Consolidated) - Sep'25",
    "rhs": [
      {
        "prefix": "Net Sales ",
        "suffix": " Growth in half year ended Sep 2025 is 24.93% vs -17.77% in Sep 2024",
        "dir": 1
      },
      {
        "prefix": "Consolidated Net Profit ",
        "suffix": " Growth in half year ended Sep 2025 is 44.21% vs -26.09% in Sep 2024",
        "dir": 1
      }
    ],
    "table": {
      "header": [
        "Sep'25",
        "Sep'24",
        "Change(%)"
      ],
      "body": [
        {
          "field": "Net Sales",
          "val1": "203.11",
          "val2": "162.58",
          "chgp": "24.93%",
          "chgp_class": "positive"
        },
        {
          "field": "Operating Profit (PBDIT) excl Other Income",
          "val1": "26.94",
          "val2": "18.00",
          "chgp": "49.67%",
          "chgp_class": "positive"
        },
        {
          "field": "Interest",
          "val1": "7.21",
          "val2": "5.40",
          "chgp": "33.52%",
          "chgp_class": "negative"
        },
        {
          "field": "Exceptional Items",
          "val1": "0.00",
          "val2": "0.00",
          "chgp": "",
          "chgp_class": "neutral"
        },
        {
          "field": "Consolidate Net Profit",
          "val1": "13.44",
          "val2": "9.32",
          "chgp": "44.21%",
          "chgp_class": "positive"
        },
        {
          "field": "Operating Profit Margin (Excl OI)",
          "val1": "13.26%",
          "val2": "11.07%",
          "chgp": "2.19%",
          "chgp_class": "positive"
        }
      ]
    }
  },
  {
    "link": "nine-monthly",
    "btn_text": "All Nine Monthly Results",
    "header": "Nine Monthly Results Snapshot (Consolidated) - Dec'25",
    "rhs": [
      {
        "prefix": "Net Sales ",
        "suffix": "YoY Growth in nine months ended Dec 2025 is 40.54% vs -19.73% in Dec 2024",
        "dir": 1
      },
      {
        "prefix": "Consolidated Net Profit ",
        "suffix": "YoY Growth in nine months ended Dec 2025 is 95.84% vs -40.27% in Dec 2024",
        "dir": 1
      }
    ],
    "table": {
      "header": [
        "Dec'25",
        "Dec'24",
        "Change(%)"
      ],
      "body": [
        {
          "field": "Net Sales",
          "val1": "328.42",
          "val2": "233.69",
          "chgp": "40.54%",
          "chgp_class": "positive"
        },
        {
          "field": "Operating Profit (PBDIT) excl Other Income",
          "val1": "45.91",
          "val2": "28.35",
          "chgp": "61.94%",
          "chgp_class": "positive"
        },
        {
          "field": "Interest",
          "val1": "12.03",
          "val2": "9.29",
          "chgp": "29.49%",
          "chgp_class": "negative"
        },
        {
          "field": "Exceptional Items",
          "val1": "0.00",
          "val2": "0.00",
          "chgp": "",
          "chgp_class": "neutral"
        },
        {
          "field": "Consolidate Net Profit",
          "val1": "23.56",
          "val2": "12.03",
          "chgp": "95.84%",
          "chgp_class": "positive"
        },
        {
          "field": "Operating Profit Margin (Excl OI)",
          "val1": "13.98%",
          "val2": "12.13%",
          "chgp": "1.85%",
          "chgp_class": "positive"
        }
      ]
    }
  },
  {
    "link": "annual",
    "btn_text": "All Annual Results",
    "header": "Annual Results Snapshot (Consolidated) - Mar'26",
    "rhs": [
      {
        "prefix": "Net Sales ",
        "suffix": "YoY Growth in year ended Mar 2026 is 30.75% vs 20.33% in Mar 2025",
        "dir": 1
      },
      {
        "prefix": "Consolidated Net Profit ",
        "suffix": "YoY Growth in year ended Mar 2026 is 73.45% vs 29.87% in Mar 2025",
        "dir": 1
      }
    ],
    "table": {
      "header": [
        "Mar'26",
        "Mar'25",
        "Change(%)"
      ],
      "body": [
        {
          "field": "Net Sales",
          "val1": "525.94",
          "val2": "402.24",
          "chgp": "30.75%",
          "chgp_class": "positive"
        },
        {
          "field": "Operating Profit (PBDIT) excl Other Income",
          "val1": "79.71",
          "val2": "53.83",
          "chgp": "48.08%",
          "chgp_class": "positive"
        },
        {
          "field": "Interest",
          "val1": "14.83",
          "val2": "13.09",
          "chgp": "13.29%",
          "chgp_class": "negative"
        },
        {
          "field": "Exceptional Items",
          "val1": "0.00",
          "val2": "0.00",
          "chgp": "",
          "chgp_class": "neutral"
        },
        {
          "field": "Consolidate Net Profit",
          "val1": "44.42",
          "val2": "25.61",
          "chgp": "73.45%",
          "chgp_class": "positive"
        },
        {
          "field": "Operating Profit Margin (Excl OI)",
          "val1": "15.16%",
          "val2": "13.38%",
          "chgp": "1.78%",
          "chgp_class": "positive"
        }
      ]
    }
  }
]

Quarterly Results Snapshot (Consolidated) - Jun'26 - QoQstock-summary

Jun'26
Mar'26
Change(%)
Net Sales
154.55
197.52
-21.75%
Operating Profit (PBDIT) excl Other Income
24.24
33.80
-28.28%
Interest
5.22
2.79
87.10%
Exceptional Items
0.00
0.00
Consolidate Net Profit
13.03
20.86
-37.54%
Operating Profit Margin (Excl OI)
15.68%
17.11%
-1.43%
Values in Rs Cr.
Direction Arrows
Net Sales

QoQ Growth in quarter ended Jun 2026 is -21.75% vs 57.63% in Mar 2026

Direction Arrows
Consolidated Net Profit

QoQ Growth in quarter ended Jun 2026 is -37.54% vs 106.13% in Mar 2026

Half Yearly Results Snapshot (Consolidated) - Sep'25stock-summary

Sep'25
Sep'24
Change(%)
Net Sales
203.11
162.58
24.93%
Operating Profit (PBDIT) excl Other Income
26.94
18.00
49.67%
Interest
7.21
5.40
33.52%
Exceptional Items
0.00
0.00
Consolidate Net Profit
13.44
9.32
44.21%
Operating Profit Margin (Excl OI)
13.26%
11.07%
2.19%
Values in Rs Cr.
Direction Arrows
Net Sales

Growth in half year ended Sep 2025 is 24.93% vs -17.77% in Sep 2024

Direction Arrows
Consolidated Net Profit

Growth in half year ended Sep 2025 is 44.21% vs -26.09% in Sep 2024

Nine Monthly Results Snapshot (Consolidated) - Dec'25stock-summary

Dec'25
Dec'24
Change(%)
Net Sales
328.42
233.69
40.54%
Operating Profit (PBDIT) excl Other Income
45.91
28.35
61.94%
Interest
12.03
9.29
29.49%
Exceptional Items
0.00
0.00
Consolidate Net Profit
23.56
12.03
95.84%
Operating Profit Margin (Excl OI)
13.98%
12.13%
1.85%
Values in Rs Cr.
Direction Arrows
Net Sales

YoY Growth in nine months ended Dec 2025 is 40.54% vs -19.73% in Dec 2024

Direction Arrows
Consolidated Net Profit

YoY Growth in nine months ended Dec 2025 is 95.84% vs -40.27% in Dec 2024

Annual Results Snapshot (Consolidated) - Mar'26stock-summary

Mar'26
Mar'25
Change(%)
Net Sales
525.94
402.24
30.75%
Operating Profit (PBDIT) excl Other Income
79.71
53.83
48.08%
Interest
14.83
13.09
13.29%
Exceptional Items
0.00
0.00
Consolidate Net Profit
44.42
25.61
73.45%
Operating Profit Margin (Excl OI)
15.16%
13.38%
1.78%
Values in Rs Cr.
Direction Arrows
Net Sales

YoY Growth in year ended Mar 2026 is 30.75% vs 20.33% in Mar 2025

Direction Arrows
Consolidated Net Profit

YoY Growth in year ended Mar 2026 is 73.45% vs 29.87% in Mar 2025

stock-summaryCompany CV
About Spectrum Electrical Industries Ltd stock-summary
stock-summary
Spectrum Electrical Industries Ltd
Small Cap
Other Electrical Equipment
Spectrum Electrical Industries Limited was originally incorporated as a Private Limited company with the name "Spectrum Polytech Private Limited" on August 12, 2008. The name of Company was changed to Spectrum Electrical Component Private Limited on March 11, 2014. Further, name of the Company was changed to Spectrum Electrical Industries Private Limited on June 14, 2018.
Company Coordinates stock-summary
Company Details
Plot No. V -195,, Midc Area, Ajanta Road,, None, Jalgaon Maharashtra : 425003
stock-summary
Tel: 02-57 2210 192
stock-summary
Registrar Details