
Compare Spectrum Electr. with Similar Stocks
Stock DNA
Other Electrical Equipment
INR 3,734 Cr (Small Cap)
77.00
52
0.00%
0.76
17.74%
15.95
Total Returns (Price + Dividend) 
Latest dividend: 1 per share ex-dividend date: May-26-2023
Risk Adjusted Returns v/s
Returns Beta

News
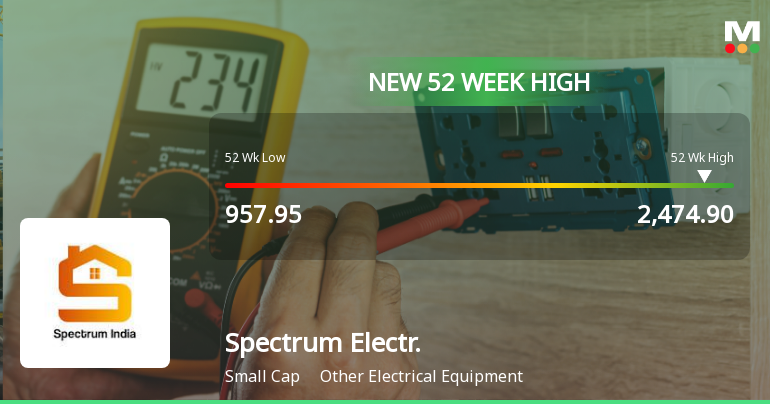
Broad-Based Technical Strength Lifts Spectrum Electrical Industries Ltd to 52-Week High of Rs 2474.9
With a remarkable 46.31% gain over the past year, Spectrum Electrical Industries Ltd surged to a new 52-week high of Rs 2474.9 on 30 Jul 2026, showcasing a powerful alignment of technical indicators that have propelled this small-cap stock well beyond its previous peaks.
Read full news article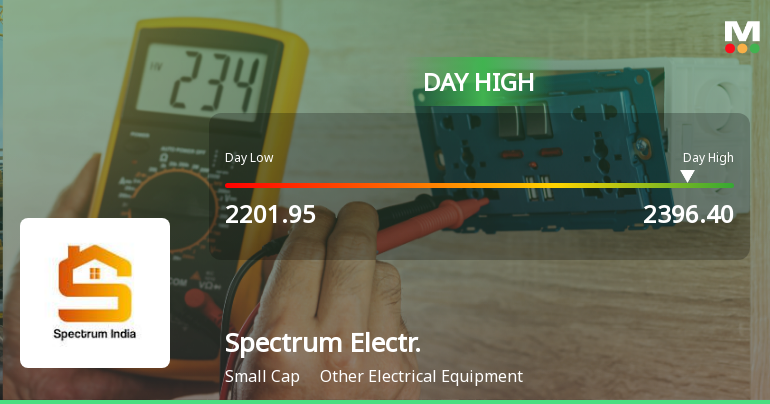
Spectrum Electrical Industries Ltd Surges 8.22% to Day's High of Rs 2396.4 — Outperforms Sector by 9.68 Percentage Points
The Sensex edged up 0.07% on 28 Jul 2026, while Spectrum Electrical Industries Ltd surged 8.22%, touching a new 52-week and all-time high of Rs 2396.4. This 9.68-percentage-point outperformance over its sector signals a distinctly stock-specific rally rather than a broad market lift.
Read full news article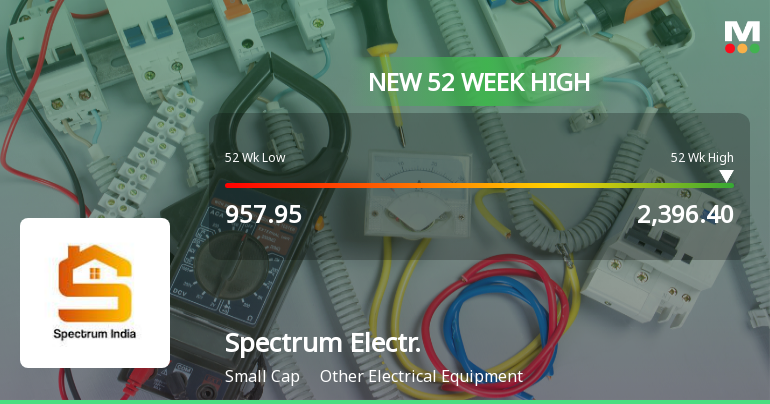
Broad-Based Technical Strength Lifts Spectrum Electrical Industries Ltd to 52-Week High of Rs 2396.4
With a decisive surge to Rs 2396.4 on 28 Jul 2026, Spectrum Electrical Industries Ltd has reached a fresh 52-week and all-time high, marking a remarkable 48.40% gain over the past year. This milestone comes amid a backdrop of strong technical momentum and sustained earnings growth, setting the stage for a compelling price rally.
Read full news article Announcements
Spectrum Electrical Industries Limited - Limited Review Report
22-Oct-2019 | Source : NSESpectrum Electrical Industries Limited has informed the Exchange regarding Limited Review Report for the Quarter ended September 30, 2019
Spectrum Electrical Industries Limited - Updates
17-Oct-2019 | Source : NSESpectrum Electrical Industries Limited has informed the Exchange regarding '"Spectrum Electrical Industries Limited has been intimated regarding incorporation of Wholly Owned Subsidiary of the Company."'.
Corporate Actions

No Upcoming Board Meetings

Spectrum Electrical Industries Ltd has declared 10% dividend, ex-date: 26 May 23

No Splits history available

No Bonus history available

No Rights history available
Quality key factors
Valuation key factors
Technicals key factors
 Technical Indicator Scale: Bearish, Mildly Bearish, Sideways, Mildly Bullish, Bullish Turned
 Shareholding Snapshot : Jun 2026
Shareholding Compare (%holding)
Promoters
None
Held by 0 Schemes
Held by 3 FIIs (3.64%)
Deepak Suresh Chaudhari (53.05%)
Sunil Pralhad Jangle (4.82%)
13.57%
Quarterly Results Snapshot (Standalone) - Mar'26 - QoQ

QoQ Growth in quarter ended Mar 2026 is 53.93% vs 3.14% in Dec 2025
QoQ Growth in quarter ended Mar 2026 is 112.83% vs 16.02% in Dec 2025
Half Yearly Results Snapshot (Consolidated) - Sep'25
Growth in half year ended Sep 2025 is 24.93% vs -17.77% in Sep 2024
Growth in half year ended Sep 2025 is 44.21% vs -26.09% in Sep 2024
Nine Monthly Results Snapshot (Consolidated) - Dec'25
YoY Growth in nine months ended Dec 2025 is 40.54% vs -44.30% in Dec 2024
YoY Growth in nine months ended Dec 2025 is 95.84% vs -64.26% in Dec 2024
Annual Results Snapshot (Consolidated) - Mar'26
YoY Growth in year ended Mar 2026 is 30.75% vs 20.33% in Mar 2025
YoY Growth in year ended Mar 2026 is 73.45% vs 29.87% in Mar 2025
About Spectrum Electrical Industries Ltd

Company Coordinates


