
Compare Kshitij Polyline with Similar Stocks
Dashboard
Weak Long Term Fundamental Strength with an average Return on Capital Employed (ROCE) of 1.20%
- Poor long term growth as Net Sales has grown by an annual rate of 2.85% and Operating profit at 3.40% over the last 5 years
- Low ability to service debt as the company has a high Debt to EBITDA ratio of 3.20 times
With a growth in Net Profit of 348%, the company declared Very Positive results in Mar 26
With ROCE of 3.6, it has a Attractive valuation with a 1 Enterprise value to Capital Employed
Stock DNA
Diversified consumer products
INR 64 Cr (Micro Cap)
18.00
36
0.00%
0.29
5.93%
1.06
Total Returns (Price + Dividend) 
Kshitij Polyline for the last several years.
Risk Adjusted Returns v/s
Returns Beta

News
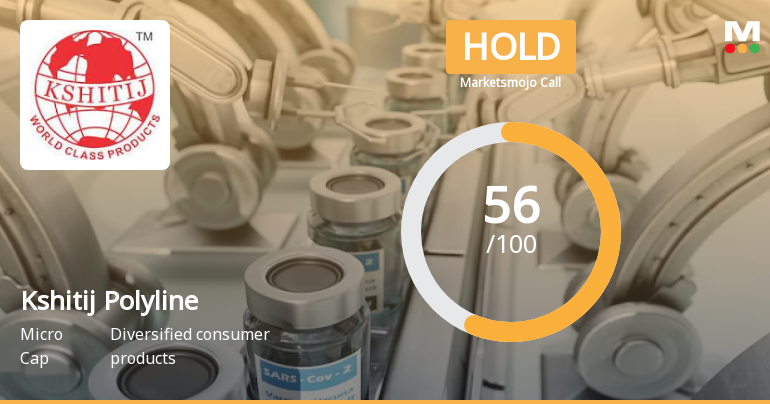
Kshitij Polyline Ltd is Rated Hold by MarketsMOJO
Kshitij Polyline Ltd is rated 'Hold' by MarketsMOJO, with this rating last updated on 04 May 2026. However, the analysis and financial metrics presented here reflect the stock's current position as of 29 June 2026, providing investors with the most up-to-date view of its performance and prospects.
Read full news article
Kshitij Polyline Ltd Locks at Lower Circuit With 4.83% Loss — Sellers Queue, No Buyers in Sight
At Rs 4.14, sellers were still queuing — but there were no buyers willing to take the other side. Kshitij Polyline Ltd locked at its lower circuit of 4.83% on 29 Jun 2026, with unfilled sell orders and a frozen price, reflecting persistent selling pressure in a micro-cap stock with limited liquidity.
Read full news article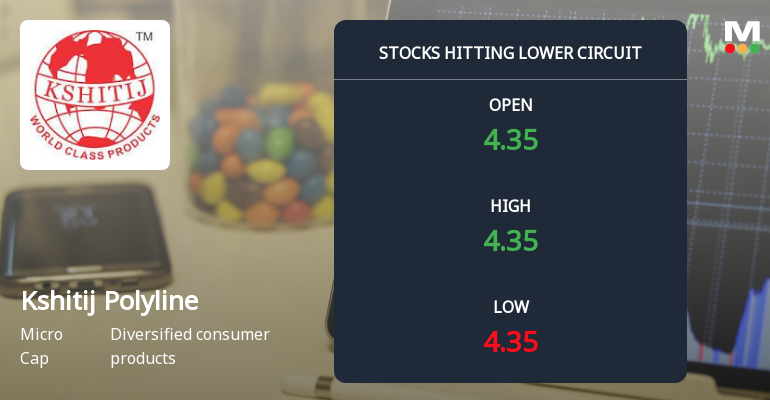
Kshitij Polyline Ltd Locks at Lower Circuit With 4.8% Loss — Sellers Queue, No Buyers in Sight
At Rs 4.35, sellers were still queuing — but there were no buyers willing to take the other side. Kshitij Polyline Ltd locked at its lower circuit of 4.81% on 25 Jun 2026, with unfilled sell orders and a frozen price, reflecting persistent selling pressure in a micro-cap stock with limited liquidity.
Read full news article Announcements
Kshitij Polyline Limited - Reply to Clarification- Financial results
28-Nov-2019 | Source : NSEKshitij Polyline Limitedhitij Polyline Limited for the quarter ended 30-Sep-2019 with respect to Regulation 33 of the SEBI (Listing Obligations and Disclosure Requirements) Regulations, 2015.
Kshitij Polyline Limited - Outcome of Board Meeting
15-Nov-2019 | Source : NSEKshitij Polyline Limited has informed the Exchange regarding Board meeting held on November 14, 2019.
Corporate Actions

No Upcoming Board Meetings

No Dividend history available

Kshitij Polyline Ltd has announced 2:10 stock split, ex-date: 27 Oct 22

Kshitij Polyline Ltd has announced 1:6 bonus issue, ex-date: 13 Aug 21

Kshitij Polyline Ltd has announced 4:5 rights issue, ex-date: 18 Jun 24
Quality key factors
Valuation key factors
Technicals key factors
 Technical Indicator Scale: Bearish, Mildly Bearish, Sideways, Mildly Bullish, Bullish Turned
 Shareholding Snapshot : Mar 2026
Shareholding Compare (%holding)
Non Institution
None
Held by 0 Schemes
Held by 1 FIIs (0.16%)
Lucky Plastics & Stationery Ltd. (0.0%)
Potential Electrical & Electronics Pvt Ltd (8.87%)
75.19%
Quarterly Results Snapshot (Consolidated) - Mar'26 - QoQ

QoQ Growth in quarter ended Mar 2026 is 24.67% vs -11.95% in Dec 2025
QoQ Growth in quarter ended Mar 2026 is 255.74% vs 19.61% in Dec 2025
Half Yearly Results Snapshot (Consolidated) - Sep'25
Growth in half year ended Sep 2025 is -14.45% vs -18.77% in Sep 2024
Growth in half year ended Sep 2025 is 128.24% vs -55.96% in Sep 2024
Nine Monthly Results Snapshot (Consolidated) - Dec'25
YoY Growth in nine months ended Dec 2025 is -10.30% vs -20.56% in Dec 2024
YoY Growth in nine months ended Dec 2025 is 140.26% vs -4,000.00% in Dec 2024
Annual Results Snapshot (Consolidated) - Mar'26
YoY Growth in year ended Mar 2026 is 6.78% vs -29.44% in Mar 2025
YoY Growth in year ended Mar 2026 is 156.58% vs -524.84% in Mar 2025
About Kshitij Polyline Ltd

Company Coordinates


