
Compare Kshitij Polyline with Similar Stocks
Dashboard
Weak Long Term Fundamental Strength with an average Return on Capital Employed (ROCE) of 1.20%
- Poor long term growth as Net Sales has grown by an annual rate of 2.85% and Operating profit at 3.40% over the last 5 years
- Low ability to service debt as the company has a high Debt to EBITDA ratio of 3.20 times
With a growth in Net Profit of 348%, the company declared Very Positive results in Mar 26
With ROCE of 3.6, it has a Attractive valuation with a 0.7 Enterprise value to Capital Employed
Majority shareholders : Non Institution
Below par performance in long term as well as near term
Stock DNA
Diversified consumer products
INR 38 Cr (Micro Cap)
10.00
35
0.00%
0.29
5.93%
0.64
Total Returns (Price + Dividend) 
Kshitij Polyline for the last several years.
Risk Adjusted Returns v/s
Returns Beta

News
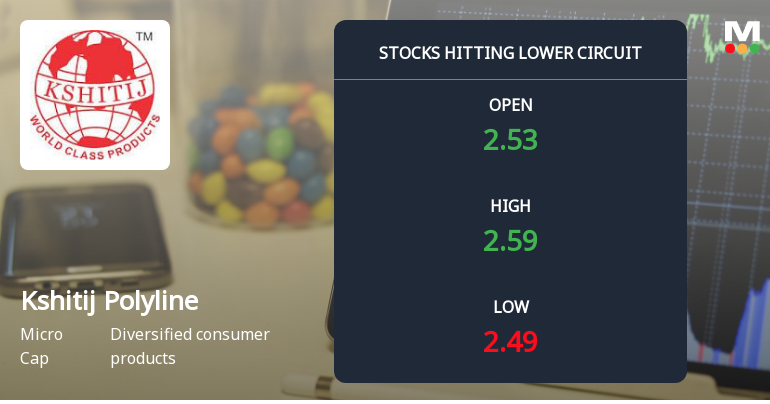
Kshitij Polyline Ltd Locks at Lower Circuit With 4.96% Loss — Sellers Queue, No Buyers in Sight
At Rs 2.49, sellers were still queuing — but there were no buyers willing to take the other side. Kshitij Polyline Ltd locked at its lower circuit of 4.96% on 17 Jul 2026, with unfilled sell orders and a frozen price.
Read full news article
Kshitij Polyline Ltd Locks at Lower Circuit With 4.7% Loss — Sellers Queue, No Buyers in Sight
At Rs 2.62, sellers were still queuing — but there were no buyers willing to take the other side. Kshitij Polyline Ltd locked at its lower circuit of 4.73% on 16 Jul 2026, with unfilled sell orders and a frozen price.
Read full news article
Kshitij Polyline Ltd Locks at Lower Circuit With 4.8% Loss — Sellers Queue, No Buyers in Sight
At Rs 2.75, sellers were still queuing — but there were no buyers willing to take the other side. Kshitij Polyline Ltd locked at its lower circuit of 4.84% on 15 Jul 2026, with unfilled sell orders and a frozen price, reflecting persistent selling pressure in a micro-cap stock with limited liquidity.
Read full news article Announcements
Kshitij Polyline Limited - Reply to Clarification- Financial results
28-Nov-2019 | Source : NSEKshitij Polyline Limitedhitij Polyline Limited for the quarter ended 30-Sep-2019 with respect to Regulation 33 of the SEBI (Listing Obligations and Disclosure Requirements) Regulations, 2015.
Kshitij Polyline Limited - Outcome of Board Meeting
15-Nov-2019 | Source : NSEKshitij Polyline Limited has informed the Exchange regarding Board meeting held on November 14, 2019.
Corporate Actions

No Upcoming Board Meetings

No Dividend history available

Kshitij Polyline Ltd has announced 2:10 stock split, ex-date: 27 Oct 22

Kshitij Polyline Ltd has announced 1:6 bonus issue, ex-date: 13 Aug 21

Kshitij Polyline Ltd has announced 4:5 rights issue, ex-date: 18 Jun 24
Quality key factors
Valuation key factors
Technicals key factors
 Technical Indicator Scale: Bearish, Mildly Bearish, Sideways, Mildly Bullish, Bullish Turned
 Shareholding Snapshot : Mar 2026
Shareholding Compare (%holding)
Non Institution
None
Held by 0 Schemes
Held by 1 FIIs (0.16%)
Lucky Plastics & Stationery Ltd. (0.0%)
Potential Electrical & Electronics Pvt Ltd (8.87%)
75.19%
Quarterly Results Snapshot (Consolidated) - Mar'26 - QoQ

QoQ Growth in quarter ended Mar 2026 is 24.67% vs -11.95% in Dec 2025
QoQ Growth in quarter ended Mar 2026 is 255.74% vs 19.61% in Dec 2025
Half Yearly Results Snapshot (Consolidated) - Sep'25
Growth in half year ended Sep 2025 is -14.45% vs -18.77% in Sep 2024
Growth in half year ended Sep 2025 is 128.24% vs -55.96% in Sep 2024
Nine Monthly Results Snapshot (Consolidated) - Dec'25
YoY Growth in nine months ended Dec 2025 is -10.30% vs -20.56% in Dec 2024
YoY Growth in nine months ended Dec 2025 is 140.26% vs -4,000.00% in Dec 2024
Annual Results Snapshot (Consolidated) - Mar'26
YoY Growth in year ended Mar 2026 is 6.78% vs -29.44% in Mar 2025
YoY Growth in year ended Mar 2026 is 156.58% vs -524.84% in Mar 2025
About Kshitij Polyline Ltd

Company Coordinates


