
Compare Iris Clothings with Similar Stocks
Stock DNA
Garments & Apparels
INR 775 Cr (Micro Cap)
48.00
26
0.00%
0.23
11.42%
5.50
Total Returns (Price + Dividend) 
Iris Clothings for the last several years.
Risk Adjusted Returns v/s
Returns Beta

News
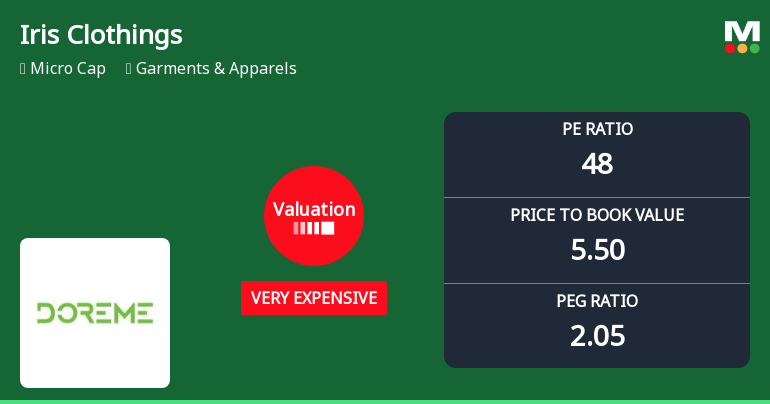
Iris Clothings Ltd Valuation Shifts Signal Heightened Price Premium
Iris Clothings Ltd, a micro-cap player in the Garments & Apparels sector, has recently undergone a notable shift in its valuation parameters, moving from an expensive to a very expensive rating. This change, coupled with its current price-to-earnings (P/E) ratio of 48.13 and price-to-book value (P/BV) of 5.50, raises important questions about the stock’s price attractiveness relative to its historical levels and peer group benchmarks.
Read full news article
Iris Clothings Ltd is Rated Buy by MarketsMOJO
Iris Clothings Ltd is rated Buy by MarketsMOJO, with this rating last updated on 21 May 2026. However, the analysis and financial metrics discussed here reflect the stock’s current position as of 20 June 2026, providing investors with the most up-to-date insight into the company’s performance and outlook.
Read full news article
Iris Clothings Ltd is Rated Buy by MarketsMOJO
Iris Clothings Ltd is rated Buy by MarketsMOJO, with this rating last updated on 21 May 2026. While the rating change occurred on that date, the analysis and financial metrics discussed here reflect the company’s current position as of 09 June 2026, providing investors with the most up-to-date view of the stock’s fundamentals, returns, and technical outlook.
Read full news article Announcements
Iris Clothings Limited - Outcome of Board Meeting
13-Nov-2019 | Source : NSEIris Clothings Limited has informed the Exchange regarding Board meeting held on November 13, 2019.
Iris Clothings Limited - Updates
17-Oct-2019 | Source : NSEIris Clothings Limited has informed the Exchange regarding 'Certificate Pursuant to Regulation 74(5) of SEBI (Depositiories and Participants) Regulation, 2018'.
Iris Clothings Limited - Updates
16-Oct-2019 | Source : NSEIris Clothings Limited has informed the Exchange regarding 'Declaration with respect to Non - Applicability of Corporate Governance under Regulation 27(2).'.
Corporate Actions

No Upcoming Board Meetings

No Dividend history available

Iris Clothings Ltd has announced 2:10 stock split, ex-date: 11 Aug 23

Iris Clothings Ltd has announced 1:1 bonus issue, ex-date: 04 Jul 25

Iris Clothings Ltd has announced 1:6 rights issue, ex-date: 13 Mar 25
Quality key factors
Valuation key factors
Technicals key factors
 Technical Indicator Scale: Bearish, Mildly Bearish, Sideways, Mildly Bullish, Bullish Turned
 Shareholding Snapshot : Mar 2026
Shareholding Compare (%holding)
Promoters
None
Held by 0 Schemes
Held by 3 FIIs (0.0%)
Geeta Ladha (41.1%)
Stellar Growth Advisors Private Limited (3.25%)
25.75%
Quarterly Results Snapshot (Standalone) - Mar'26 - QoQ

QoQ Growth in quarter ended Mar 2026 is 24.27% vs 9.81% in Dec 2025
QoQ Growth in quarter ended Mar 2026 is 113.62% vs -26.94% in Dec 2025
Half Yearly Results Snapshot (Standalone) - Sep'25

Growth in half year ended Sep 2025 is 12.42% vs 29.07% in Sep 2024
Growth in half year ended Sep 2025 is 7.66% vs -6.97% in Sep 2024
Nine Monthly Results Snapshot (Standalone) - Dec'25
YoY Growth in nine months ended Dec 2025 is 22.93% vs 32.92% in Dec 2024
YoY Growth in nine months ended Dec 2025 is 12.96% vs -1.03% in Dec 2024
Annual Results Snapshot (Standalone) - Mar'26
YoY Growth in year ended Mar 2026 is 30.49% vs 19.97% in Mar 2025
YoY Growth in year ended Mar 2026 is 23.40% vs 7.45% in Mar 2025
About Iris Clothings Ltd

Company Coordinates


