
Compare Iris Clothings with Similar Stocks
Dashboard
Poor long term growth as Net Sales has grown by an annual rate of 14.58% and Operating profit at 12.33% over the last 5 years
Positive results in Jun 26
With ROCE of 14, it has a Very Expensive valuation with a 5.6 Enterprise value to Capital Employed
Despite the size of the company, domestic mutual funds hold only 0% of the company
Below par performance in long term as well as near term
Stock DNA
Garments & Apparels
INR 947 Cr (Micro Cap)
53.00
25
0.00%
0.23
12.39%
6.63
Total Returns (Price + Dividend) 
Iris Clothings for the last several years.
Risk Adjusted Returns v/s
Returns Beta

News
Are Iris Clothings Ltd latest results good or bad?
Iris Clothings Ltd's latest financial results for Q1 FY27 present a mixed picture of performance. The company reported net sales of ₹47.24 crores, reflecting a year-on-year growth of 26.31%. However, this figure represents a sequential decline of 21.89% from the previous quarter, which is consistent with typical seasonal patterns in the garment industry but is more pronounced than usual. The operating profit margin, excluding other income, contracted to 17.06% from 20.15% in the same quarter last year, indicating margin compression that warrants attention. This decline in margin occurred despite the revenue growth, suggesting potential challenges related to rising input costs or pricing pressures. Additionally, employee costs surged by 33.59% year-on-year, further impacting profitability. Net profit for the quarter was ₹4.01 crores, which is a significant year-on-year increase of 52.47%. However, it repre...
Read full news article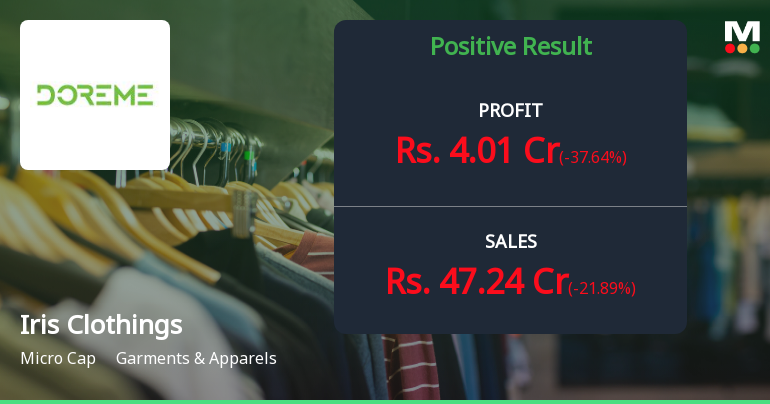
Iris Clothings Q1 FY27: Strong Revenue Growth Masks Margin Pressure
Iris Clothings Ltd., a micro-cap branded kids' wear manufacturer, reported net profit of ₹4.01 crores for Q1 FY27, marking a sequential decline of 37.63% from Q4 FY26's ₹6.43 crores, though demonstrating robust year-on-year growth of 52.47% from ₹2.63 crores in Q1 FY26. The company's shares, currently trading at ₹48.29 with a market capitalisation of ₹918.00 crores, have surged 58.43% over the past year, significantly outperforming the Sensex's negative 5.68% return during the same period.
Read full news article
Iris Clothings Ltd Reports Positive Quarterly Growth Amid Margin Pressure
Iris Clothings Ltd, a micro-cap player in the Garments & Apparels sector, reported a positive yet moderated financial performance for the quarter ended June 2026. While revenue growth remains robust, margin expansion has slowed, prompting a downgrade in the company’s Mojo Grade from Buy to Hold as of 21 May 2026. This article analyses the latest quarterly results in the context of historical trends and market performance.
Read full news article Announcements
Iris Clothings Limited - Outcome of Board Meeting
13-Nov-2019 | Source : NSEIris Clothings Limited has informed the Exchange regarding Board meeting held on November 13, 2019.
Iris Clothings Limited - Updates
17-Oct-2019 | Source : NSEIris Clothings Limited has informed the Exchange regarding 'Certificate Pursuant to Regulation 74(5) of SEBI (Depositiories and Participants) Regulation, 2018'.
Iris Clothings Limited - Updates
16-Oct-2019 | Source : NSEIris Clothings Limited has informed the Exchange regarding 'Declaration with respect to Non - Applicability of Corporate Governance under Regulation 27(2).'.
Corporate Actions

No Upcoming Board Meetings

No Dividend history available

Iris Clothings Ltd has announced 2:10 stock split, ex-date: 11 Aug 23

Iris Clothings Ltd has announced 1:1 bonus issue, ex-date: 04 Jul 25

Iris Clothings Ltd has announced 1:6 rights issue, ex-date: 13 Mar 25
Quality key factors
Valuation key factors
Technicals key factors
 Technical Indicator Scale: Bearish, Mildly Bearish, Sideways, Mildly Bullish, Bullish Turned
 Shareholding Snapshot : Jun 2026
Shareholding Compare (%holding)
Promoters
None
Held by 0 Schemes
Held by 2 FIIs (0.0%)
Geeta Ladha (41.1%)
Stellar Iradvisors Private Limited (5.51%)
25.89%
Quarterly Results Snapshot (Standalone) - Jun'26 - QoQ

QoQ Growth in quarter ended Jun 2026 is -21.89% vs 24.27% in Mar 2026
QoQ Growth in quarter ended Jun 2026 is -37.64% vs 113.62% in Mar 2026
Half Yearly Results Snapshot (Standalone) - Sep'25
Growth in half year ended Sep 2025 is 12.42% vs 29.07% in Sep 2024

Growth in half year ended Sep 2025 is 7.66% vs -6.97% in Sep 2024
Nine Monthly Results Snapshot (Standalone) - Dec'25
YoY Growth in nine months ended Dec 2025 is 22.93% vs 32.92% in Dec 2024
YoY Growth in nine months ended Dec 2025 is 12.96% vs -1.03% in Dec 2024
Annual Results Snapshot (Standalone) - Mar'26
YoY Growth in year ended Mar 2026 is 30.49% vs 19.97% in Mar 2025
YoY Growth in year ended Mar 2026 is 23.40% vs 7.45% in Mar 2025
About Iris Clothings Ltd

Company Coordinates


