
Dashboard
Weak Long Term Fundamental Strength with a -2.87% CAGR growth in Operating Profits over the last 5 years
- Low ability to service debt as the company has a high Debt to EBITDA ratio of 3.67 times
- The company has been able to generate a Return on Equity (avg) of 2.43% signifying low profitability per unit of shareholders funds
Flat results in Sep 25
Stock DNA
Cement & Cement Products
INR 13,104 Cr (Small Cap)
48.00
36
0.00%
0.61
2.98%
1.43
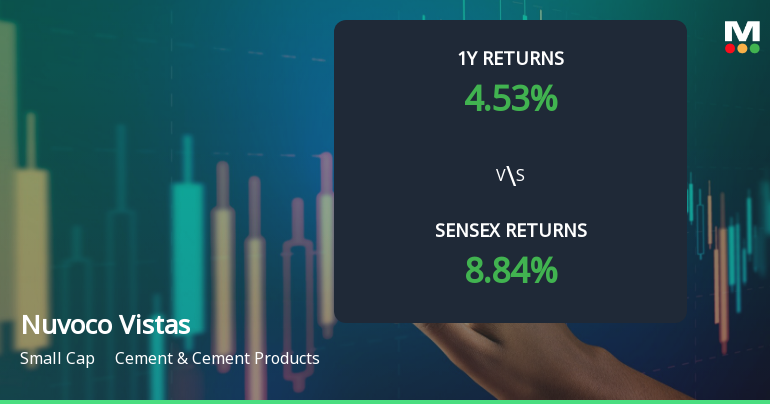
Total Returns (Price + Dividend) 
Nuvoco Vistas for the last several years.
Risk Adjusted Returns v/s
Returns Beta

News
Nuvoco Vistas Corporation: Technical Momentum Shifts Amid Mixed Market Signals
Nuvoco Vistas Corporation's stock has exhibited a nuanced shift in technical momentum, reflecting a complex interplay of bearish and bullish signals across multiple timeframes. Recent market data reveals a transition in the company’s technical trend from mildly bullish to mildly bearish, underscoring evolving investor sentiment within the Cement & Cement Products sector.
Read More
Nuvoco Vistas Corporation: Analytical Revisions Reflect Mixed Signals in Cement Sector
Nuvoco Vistas Corporation’s recent evaluation metrics have been adjusted following a comprehensive review of its quality, valuation, financial trends, and technical indicators. The cement sector player’s current market position reflects a complex interplay of operational challenges and valuation opportunities amid fluctuating technical signals.
Read More
Nuvoco Vistas Corporation Forms Death Cross, Signalling Potential Bearish Trend
Nuvoco Vistas Corporation, a key player in the Cement & Cement Products sector, has recently formed a Death Cross, a technical pattern where the 50-day moving average crosses below the 200-day moving average. This development often signals a shift towards a bearish trend and suggests a weakening momentum in the stock’s price trajectory over the longer term.
Read More Announcements
Corporate Actions

No Upcoming Board Meetings

No Dividend history available

No Splits history available

No Bonus history available

No Rights history available
Quality key factors
Valuation key factors
Technicals key factors
 Technical Indicator Scale: Bearish, Mildly Bearish, Sideways, Mildly Bullish, Bullish Turned
 Shareholding Snapshot : Sep 2025
Shareholding Compare (%holding)
Promoters
None
Held by 15 Schemes (17.97%)
Held by 135 FIIs (5.19%)
Niyogi Enterprise Private Limited (60.16%)
Sbi Flexicap Fund (9.54%)
4.01%
Quarterly Results Snapshot (Consolidated) - Sep'25 - QoQ

QoQ Growth in quarter ended Sep 2025 is -14.45% vs -5.57% in Jun 2025
QoQ Growth in quarter ended Sep 2025 is -72.64% vs -19.56% in Jun 2025
Half Yearly Results Snapshot (Consolidated) - Sep'25

Growth in half year ended Sep 2025 is 8.67% vs -8.80% in Sep 2024
Growth in half year ended Sep 2025 is 305.99% vs -614.88% in Sep 2024
Nine Monthly Results Snapshot (Consolidated) - Dec'24
YoY Growth in nine months ended Dec 2024 is -6.22% vs 1.85% in Dec 2023
YoY Growth in nine months ended Dec 2024 is -405.61% vs 125.39% in Dec 2023
Annual Results Snapshot (Consolidated) - Mar'25
YoY Growth in year ended Mar 2025 is -3.51% vs 1.39% in Mar 2024
YoY Growth in year ended Mar 2025 is -85.18% vs 829.19% in Mar 2024
About Nuvoco Vistas Corporation Ltd

Company Coordinates


