
Compare Nuvoco Vistas with Similar Stocks
Dashboard
Weak Long Term Fundamental Strength with an average Return on Capital Employed (ROCE) of 4.33%
- Poor long term growth as Net Sales has grown by an annual rate of 8.65% and Operating profit at 7.85% over the last 5 years
- Company's ability to service its debt is weak with a poor EBIT to Interest (avg) ratio of 1.26
Consistent Underperformance against the benchmark over the last 3 years
Stock DNA
Cement & Cement Products
INR 11,211 Cr (Small Cap)
29.00
33
0.00%
0.47
3.80%
1.08
Total Returns (Price + Dividend) 
Nuvoco Vistas for the last several years.
Risk Adjusted Returns v/s
Returns Beta

News
Nuvoco Vistas Corporation Ltd is Rated Sell
Nuvoco Vistas Corporation Ltd is rated 'Sell' by MarketsMOJO, with this rating last updated on 09 April 2026. However, the analysis and financial metrics presented here reflect the stock's current position as of 07 July 2026, providing investors with an up-to-date view of the company’s fundamentals, valuation, financial trends, and technical outlook.
Read full news article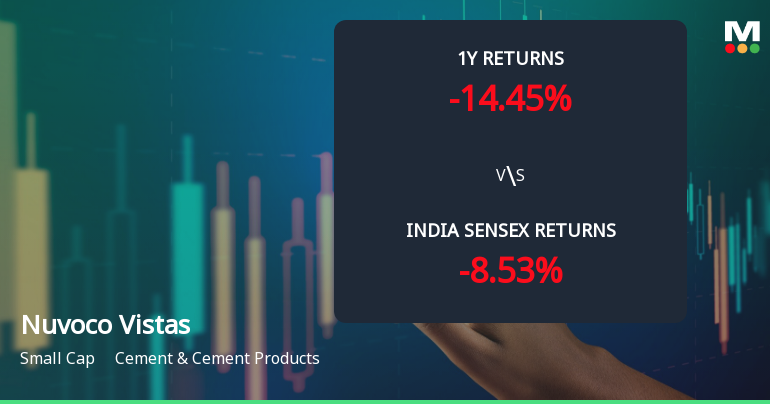
Nuvoco Vistas Corporation Ltd Technical Momentum Shifts Amid Cement Sector Challenges
Nuvoco Vistas Corporation Ltd, a small-cap player in the Cement & Cement Products sector, has experienced a nuanced shift in its technical momentum, moving from a strongly bearish stance to a mildly bearish trend. Despite a modest decline in share price, the stock’s technical indicators reveal a complex interplay of bullish and bearish signals, underscoring the need for cautious investor appraisal amid broader market pressures.
Read full news article
Nuvoco Vistas Corporation Ltd Technical Analysis: Momentum Shifts Amid Bearish Trends
Nuvoco Vistas Corporation Ltd, a small-cap player in the Cement & Cement Products sector, has experienced a notable shift in its technical momentum, moving from a mildly bearish stance to a more pronounced bearish trend. Recent technical indicators, including MACD, RSI, and moving averages, signal increasing downside pressure, reflecting the stock’s underperformance relative to the broader market benchmarks such as the Sensex.
Read full news article Announcements
Corporate Actions

13 Jul 2026

No Dividend history available

No Splits history available

No Bonus history available

No Rights history available
Quality key factors
Valuation key factors
Technicals key factors
 Technical Indicator Scale: Bearish, Mildly Bearish, Sideways, Mildly Bullish, Bullish Turned
 Shareholding Snapshot : Mar 2026
Shareholding Compare (%holding)
Promoters
None
Held by 19 Schemes (17.87%)
Held by 129 FIIs (4.88%)
Niyogi Enterprise Private Limited (60.16%)
Sbi Flexicap Fund (7.38%)
4.13%
Quarterly Results Snapshot (Consolidated) - Mar'26 - QoQ

QoQ Growth in quarter ended Mar 2026 is 22.41% vs 9.92% in Dec 2025
QoQ Growth in quarter ended Mar 2026 is 186.87% vs 34.64% in Dec 2025
Half Yearly Results Snapshot (Consolidated) - Sep'25
Growth in half year ended Sep 2025 is 8.67% vs -8.80% in Sep 2024
Growth in half year ended Sep 2025 is 305.99% vs -614.88% in Sep 2024
Nine Monthly Results Snapshot (Consolidated) - Dec'25
YoY Growth in nine months ended Dec 2025 is 9.80% vs -6.22% in Dec 2024
YoY Growth in nine months ended Dec 2025 is 252.15% vs -405.61% in Dec 2024
Annual Results Snapshot (Consolidated) - Mar'26
YoY Growth in year ended Mar 2026 is 9.48% vs -3.51% in Mar 2025
YoY Growth in year ended Mar 2026 is 1,545.38% vs -85.18% in Mar 2025
About Nuvoco Vistas Corporation Ltd

Company Coordinates


