
Compare Sustainable Ener with Similar Stocks
Dashboard
Weak Long Term Fundamental Strength with a -172.95% CAGR growth in Operating Profits over the last 5 years
- Low ability to service debt as the company has a high Debt to EBITDA ratio of -65.12 times
- The company has been able to generate a Return on Equity (avg) of 4.54% signifying low profitability per unit of shareholders funds
Flat results in Mar 26
With ROCE of 5.3, it has a Very Expensive valuation with a 1.2 Enterprise value to Capital Employed
Total Returns (Price + Dividend) 
Latest dividend: 2 per share ex-dividend date: May-22-2026
Risk Adjusted Returns v/s
Returns Beta

News
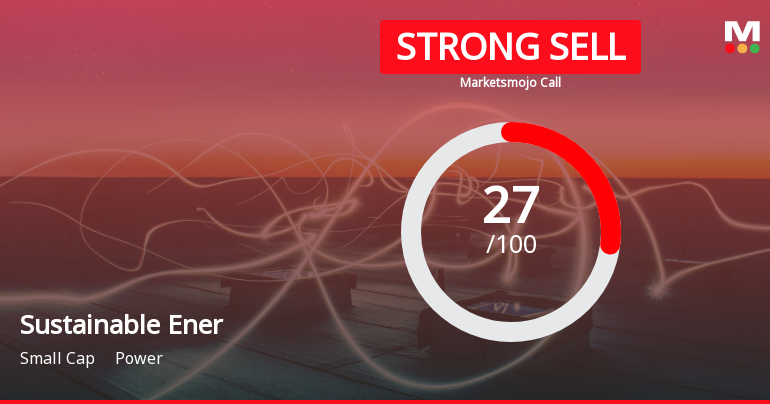
Sustainable Energy Infra Trust is Rated Strong Sell
Sustainable Energy Infra Trust is rated Strong Sell by MarketsMOJO. This rating was last updated on 02 June 2026, reflecting a reassessment of the stock’s outlook. However, all fundamentals, returns, and financial metrics discussed below are current as of 14 June 2026, providing investors with the latest perspective on the company’s position in the market.
Read full news article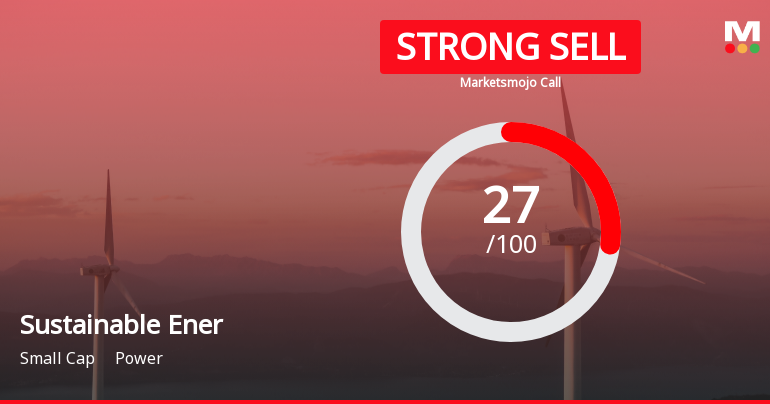
Sustainable Energy Infra Trust is Rated Strong Sell
Sustainable Energy Infra Trust is rated Strong Sell by MarketsMOJO, with this rating last updated on 02 June 2026. However, the analysis and financial metrics presented here reflect the stock's current position as of 03 June 2026, providing investors with the most up-to-date view of its fundamentals, returns, and technical outlook.
Read full news article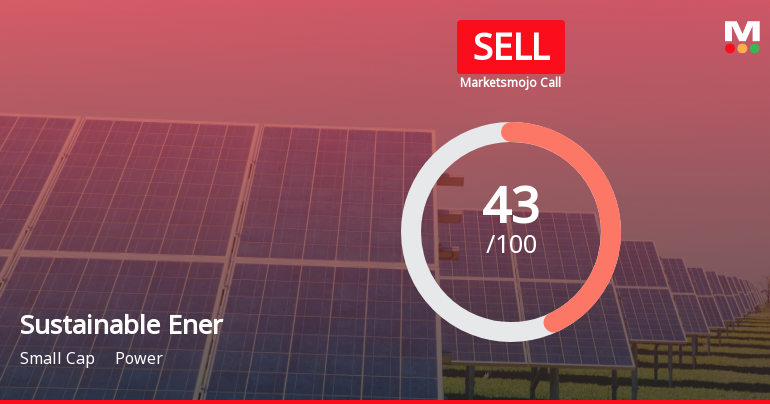
Sustainable Energy Infra Trust is Rated Sell
Sustainable Energy Infra Trust is rated 'Sell' by MarketsMOJO, with this rating last updated on 21 May 2026. However, the analysis and financial metrics discussed here reflect the stock's current position as of 23 May 2026, providing investors with the latest insights into its performance and outlook.
Read full news article Announcements
Corporate Actions

No Upcoming Board Meetings

Sustainable Energy Infra Trust has declared 2% dividend, ex-date: 22 May 26

No Splits history available

No Bonus history available

No Rights history available
Quality key factors
Valuation key factors
Technicals key factors
 Technical Indicator Scale: Bearish, Mildly Bearish, Sideways, Mildly Bullish, Bullish Turned
 Shareholding Snapshot : Mar 2026
Shareholding Compare (%holding)
Promoters
None
Held by 0 Schemes
Held by 0 FIIs
2452991 Ontario Limited (33.83%)
Asian Infrastructure Investment Bank (15%)
0.96%
Quarterly Results Snapshot (Consolidated) - Mar'26 - QoQ

QoQ Growth in quarter ended Mar 2026 is 13.34% vs 5.99% in Dec 2025

QoQ Growth in quarter ended Mar 2026 is 134.23% vs 158.33% in Dec 2025
Half Yearly Results Snapshot (Consolidated) - Sep'25
Growth in half year ended Sep 2025 is 1.71% vs -2.55% in Mar 2025
Growth in half year ended Sep 2025 is -17.14% vs 6.59% in Mar 2025
Nine Monthly Results Snapshot (Standalone) - Dec'25
Not Applicable: The company has declared_date for only one period
Not Applicable: The company has declared_date for only one period
Annual Results Snapshot (Consolidated) - Mar'26
YoY Growth in year ended Mar 2026 is 0.89% vs 312.61% in Mar 2025
YoY Growth in year ended Mar 2026 is -3.54% vs 922.83% in Mar 2025
About Sustainable Energy Infra Trust

Company Coordinates


