
Compare RattanIndia Pow. with Similar Stocks
Dashboard
Weak Long Term Fundamental Strength with a -6.65% CAGR growth in Operating Profits over the last 5 years
- Low ability to service debt as the company has a high Debt to EBITDA ratio of 9.15 times
- The company has been able to generate a Return on Equity (avg) of 1.19% signifying low profitability per unit of shareholders funds
The company has declared Negative results for the last 4 consecutive quarters
88.65% of Promoter Shares are Pledged
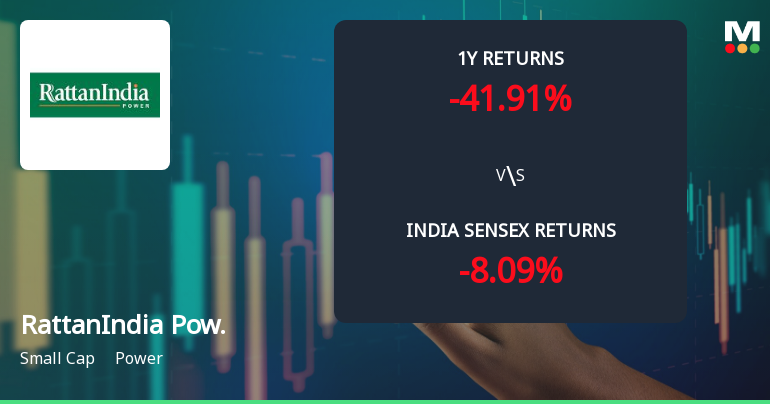
Underperformed the market in the last 1 year
Total Returns (Price + Dividend) 
RattanIndia Pow. for the last several years.
Risk Adjusted Returns v/s
Returns Beta

News
RattanIndia Power Ltd Technical Momentum Shifts Amid Mixed Indicator Signals
RattanIndia Power Ltd has experienced a nuanced shift in its technical momentum, moving from a bearish stance to a mildly bearish outlook as of early July 2026. Despite a modest day gain of 1.55%, the stock’s technical indicators present a complex picture, with weekly signals showing mild bullish tendencies contrasting with predominantly bearish monthly trends. Investors should carefully consider these mixed signals alongside the company’s recent performance and broader market context.
Read full news article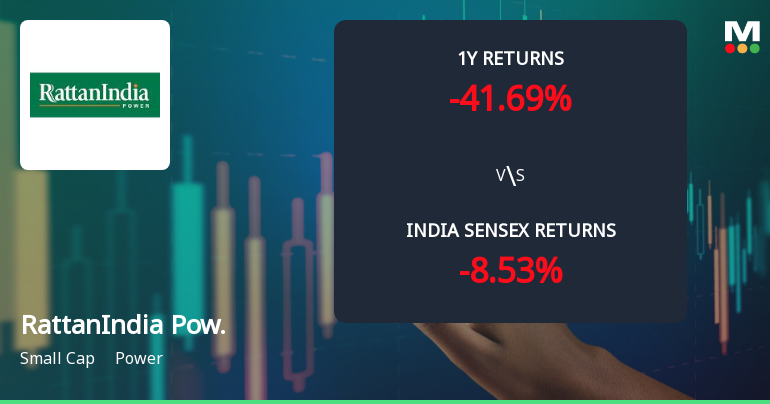
RattanIndia Power Ltd Faces Bearish Momentum Amid Mixed Technical Signals
RattanIndia Power Ltd, a small-cap player in the power sector, has experienced a notable shift in its technical momentum, with key indicators signalling a bearish trend. Despite a marginal day gain of 0.22%, the stock’s broader technical landscape reveals deteriorating momentum and increased selling pressure, prompting a downgrade in its Mojo Grade to Strong Sell as of 25 August 2025.
Read full news article
RattanIndia Power Ltd is Rated Strong Sell
RattanIndia Power Ltd is rated Strong Sell by MarketsMOJO, with this rating last updated on 25 August 2025. However, the analysis and financial metrics discussed here reflect the company’s current position as of 25 June 2026, providing investors with an up-to-date view of the stock’s fundamentals, valuation, financial trend, and technical outlook.
Read full news article Announcements
RattanIndia Power Limited - Resignation
09-Dec-2019 | Source : NSERattanIndia Power Limited has informed the Exchange regarding Resignation of Mr Pranab Kumar Sinha as Nominee Director of the company w.e.f. December 03, 2019.
RattanIndia Power Limited - Shareholders meeting
13-Nov-2019 | Source : NSERattanIndia Power Limited has informed the Exchange regarding Notice of Extraordinary General Meeting to be held on December 03, 2019
RattanIndia Power Limited - Trading Window
24-Sep-2019 | Source : NSERattanIndia Power Limited has informed the Exchange regarding the Trading Window closure pursuant to SEBI (Prohibition of Insider Trading) Regulations, 2015
Corporate Actions

No Upcoming Board Meetings

No Dividend history available

No Splits history available

No Bonus history available

No Rights history available
Quality key factors
Valuation key factors
Technicals key factors
 Technical Indicator Scale: Bearish, Mildly Bearish, Sideways, Mildly Bullish, Bullish Turned
 Shareholding Snapshot : Mar 2026
Shareholding Compare (%holding)
Non Institution
88.652
Held by 5 Schemes (0.15%)
Held by 78 FIIs (5.13%)
Rr Infralands Private Limited (24.06%)
Power Finance Corporation Ltd (4.38%)
40.17%
Quarterly Results Snapshot (Consolidated) - Mar'26 - QoQ

QoQ Growth in quarter ended Mar 2026 is 8.20% vs 11.36% in Dec 2025
QoQ Growth in quarter ended Mar 2026 is -21.05% vs 271.98% in Dec 2025
Half Yearly Results Snapshot (Consolidated) - Sep'25
Growth in half year ended Sep 2025 is -8.58% vs -1.79% in Sep 2024
Growth in half year ended Sep 2025 is -148.73% vs 107.75% in Sep 2024
Nine Monthly Results Snapshot (Consolidated) - Dec'25
YoY Growth in nine months ended Dec 2025 is -6.13% vs -4.18% in Dec 2024
YoY Growth in nine months ended Dec 2025 is -90.00% vs 105.43% in Dec 2024
Annual Results Snapshot (Consolidated) - Mar'26
YoY Growth in year ended Mar 2026 is -8.91% vs -2.38% in Mar 2025

YoY Growth in year ended Mar 2026 is -76.37% vs -97.51% in Mar 2025
About RattanIndia Power Ltd

Company Coordinates


