Australian Prem

  • Market Cap: Micro Cap
  • Industry: Other Electrical Equipment
  • ISIN: INE0P0001010
  • NSEID: APS
  • BSEID:
INR
289.00
-14.2 (-4.68%)
BSENSE

Mar 27

BSE+NSE Vol: 53000

  • Price Points
  • Score
  • Mojo Parameters
  • Total Return
  • News and Corporate Actions
  • Key factors
  • Shareholding
  • Financials
  • CompanyCV
stock-summaryPrice Point
High/Low

1Day

52 Week

Valuation
Technical
Day's Volume

CASH

53.0 k (58.92%) Volume

Shareholding (Sep 2025)

FII

0.00%

Held by 0 FIIs

DII

0.56%

Held by 0 DIIs

Promoter

72.52%

When is the next results date for Australian Prem?

06-Jun-2025

No Upcoming Board Meetings

Has Australian Prem declared dividend?

06-Jun-2025

No Dividend History Available

Who are the peers of the Australian Prem?

16-Jul-2025

Peers of Australian Prem include Solex Energy, Salzer Electronics, Rishabh Instruments, Kirl. Electric, Viviana Power, Focus Lighting, Prostarm Info, RMC Switchgears, Permanent Magnet, and Yash Highvoltage. Australian Prem has an average management risk, excellent capital structure, and a 1-year return of 2.86%.

Peers: Solex Energy, Salzer Electron., Rishabh Instrum., Kirl. Electric, Viviana Power, Focus Lighting, Prostarm Info, RMC Switchgears, Permanent Magnet, Yash Highvoltage.<BR><BR>Quality Snapshot: Excellent management risk is observed at Rishabh Instrum., while Average management risk is found at Solex Energy, Salzer Electron., Australian Prem, Viviana Power, Focus Lighting, Prostarm Info, and the rest. Growth is excellent at Solex Energy, Australian Prem, Viviana Power, and RMC Switchgears, while Average growth is seen at Salzer Electron., Prostarm Info, and the rest. Below Average capital structure is noted at Solex Energy, Salzer Electron., Kirl. Electric, and the rest, while Excellent capital structure is observed at Rishabh Instrum., Australian Prem, Focus Lighting, Prostarm Info, and Permanent Magnet.<BR><BR>Return Snapshot: Solex Energy has the highest 1-year return at 27.17%, while Rishabh Instrum. has the lowest at -31.57%. Australian Prem's 1-year return of 2.86% is higher than Rishabh Instrum.'s but lower than Solex Energy's. Additionally, Kirl. Electric, Salzer Electron., and Rishabh Instrum. have negative six-month returns.

View full answer

What does Australian Prem do?

17-Jul-2025

Australian Premium Solar (India) Ltd, a small-cap company in the Other Electrical Equipment industry, reported net sales of 1,214 Cr and a net profit of 114 Cr for December 2024. The company, originally incorporated in 2013, has a market cap of INR 1,097 Cr and a P/E ratio of 28.00.

Overview: <BR>Australian Premium Solar (India) Ltd operates in the Other Electrical Equipment industry and is classified as a Small Cap company.<BR><BR>History: <BR>The company was originally incorporated in 2013 as "Australian Solar Panel (India) Private Limited" and later changed its name to "Australian Premium Solar (India) Private Limited" on November 28, 2013. The most recent quarterly results reported net sales and net profit for December 2024.<BR><BR>Financial Snapshot: <BR>Most recent Net Sales: 1,214 Cr (Quarterly Results - Dec 2024) <BR>Most recent Net Profit: 114 Cr (Quarterly Results - Dec 2024) <BR>Market-cap value: INR 1,097 Cr (Small Cap)<BR><BR>Key Metrics: <BR>P/E: 28.00 <BR>Industry P/E: 75 <BR>Dividend Yield: 0.00% <BR>Debt-Equity: -0.44 <BR>Return on Equity: 53.51% <BR>Price to Book: 15.03<BR><BR>Contact Details: <BR>Details: No Company Details Available <BR>Registrar Address: Not available.

View full answer

Who are the top shareholders of the Australian Prem?

17-Jul-2025

The top shareholders of Australian Prem include Nikunjkumar Chimanlal Patel with 36.91%, followed by individual investors at 23.52%, and Nitaben Alpeshbhai Patel as the highest public shareholder at 1.54%. Additionally, three foreign institutional investors hold a combined 0.79%.

The top shareholders of Australian Prem include the promoters as the majority shareholders. The promoter with the highest holding is Nikunjkumar Chimanlal Patel, who holds 36.91% of the shares. Additionally, there are three foreign institutional investors (FIIs) holding a combined 0.79%. The highest public shareholder is Nitaben Alpeshbhai Patel, with a holding of 1.54%. Individual investors collectively hold 23.52% of the company's shares.

View full answer

How big is Australian Prem?

24-Jul-2025

As of 24th July, Australian Premium Solar (India) Ltd has a market capitalization of 1,063.00 Cr and reported net sales of 240.72 Cr and net profit of 19.50 Cr over the latest three quarters.

As of 24th July, <BR><BR>Market Cap: Australian Premium Solar (India) Ltd has a market capitalization of 1,063.00 Cr, classified as a Small Cap company.<BR><BR>Recent Quarterly Performance: The sum of Net Sales for the latest three quarters is 240.72 Cr, while the sum of Net Profit for the same period is 19.50 Cr.<BR><BR>Balance Sheet Snapshot: The reporting period is March 2024, with Shareholder's Funds amounting to 48.08 Cr and Total Assets valued at 80.38 Cr.

View full answer

Is Australian Prem overvalued or undervalued?

03-Sep-2025

As of September 2, 2025, Australian Prem is considered very attractive and undervalued with a PE ratio of 24.59, significantly lower than peers like Siemens Energy and ABB, despite a -4.58% return over the past year compared to the Sensex's -2.77%.

As of 2 September 2025, the valuation grade for Australian Prem has moved from attractive to very attractive, indicating a significant improvement in its valuation outlook. The company is currently considered undervalued. Key ratios include a PE ratio of 24.59, an EV to EBITDA of 17.20, and a PEG ratio of 0.05, which suggests that the stock is priced favorably relative to its growth potential.<BR><BR>In comparison to its peers, Australian Prem's valuation stands out, especially against Siemens Energy Industries, which has a PE ratio of 127.99, and ABB at 60.66, both categorized as very expensive. This stark contrast highlights Australian Prem's relative attractiveness in the market. Notably, the company's return over the past year has been -4.58%, while the Sensex has seen a decline of only -2.77%, further reinforcing the perception of undervaluation in light of its strong financial metrics.

View full answer

How has been the historical performance of Australian Prem?

01-Dec-2025

Australian Prem experienced significant growth from March 2024 to March 2025, with net sales rising to 438.88 Cr from 149.67 Cr, and profit after tax increasing to 40.10 Cr from 6.15 Cr, reflecting strong financial performance and improved margins.

Answer:<BR>The historical performance of Australian Prem shows significant growth from March 2024 to March 2025.<BR><BR>Breakdown:<BR>In March 2025, Australian Prem reported net sales of 438.88 Cr, a substantial increase from 149.67 Cr in March 2024. Total operating income mirrored this growth, rising to 438.88 Cr from 149.67 Cr. The raw material cost surged to 382.15 Cr from 127.11 Cr, while total expenditure (excluding depreciation) increased to 382.32 Cr from 140.33 Cr. Operating profit (PBDIT) also saw a remarkable rise to 58.82 Cr from 9.98 Cr, with profit before tax climbing to 53.62 Cr from 8.25 Cr. Consequently, profit after tax reached 40.10 Cr, up from 6.15 Cr, leading to an earnings per share (EPS) of 20.31 compared to 3.12 the previous year. The operating profit margin improved to 12.89% from 6.24%, and the PAT margin increased to 9.14% from 4.11%. On the balance sheet, total liabilities stood at 211.52 Cr, with total assets matching this figure. Cash flow from operating activities was reported at 24.00 Cr, contributing to a closing cash and cash equivalent of 30.00 Cr. Overall, the financial metrics indicate a robust performance and a positive trend for Australian Prem.

View full answer

Is Australian Prem technically bullish or bearish?

03-Dec-2025

As of December 2, 2025, the technical outlook for Australian Prem has shifted to bearish, supported by weak MACD signals, bearish Bollinger Bands, and underperformance against the Sensex.

As of 2 December 2025, the technical trend has changed from mildly bearish to bearish. The current technical stance is bearish with a strong indication of weakness. The weekly MACD is bearish, and both the weekly and monthly Bollinger Bands confirm a bearish trend. Daily moving averages also indicate a bearish sentiment. The stock has shown significant underperformance compared to the Sensex over multiple time frames, further reinforcing the bearish outlook. Overall, the indicators collectively suggest a bearish market condition for Australian Prem.

View full answer

Should I buy, sell or hold Australian Premium Solar (India) Ltd?

19-Feb-2026

Why is Australian Premium Solar (India) Ltd falling/rising?

18-Mar-2026

As of 17-Mar, the stock price of Australian Premium Solar (India) Ltd is at 303.00, showing a slight increase today but reflecting an overall downward trend with a 21.42% decline over the past year. Despite some positive financial metrics, the stock is underperforming and lacks investor confidence, as indicated by a significant drop in trading volume.

As of 17-Mar, the stock price of Australian Premium Solar (India) Ltd is currently at 303.00, reflecting a change of 2.85 (0.95%) upward. However, despite this slight increase, the stock has been experiencing a downward trend overall. Over the past week, the stock has decreased by 1.25%, and it has significantly underperformed in the longer term, with a decline of 16.40% over the past month and 21.42% over the past year.<BR><BR>The stock's performance today is noted as underperforming the sector by 0.66%, and it is trading below its 5-day, 20-day, 50-day, 100-day, and 200-day moving averages, indicating a bearish trend. Additionally, there has been a notable drop in investor participation, with delivery volume falling by 39.9% compared to the 5-day average, which suggests a lack of interest from investors.<BR><BR>While there are positive factors such as a low debt-to-equity ratio and impressive growth in net sales and operating profit, these have not translated into strong stock performance. The company has generated a return of -21.42% over the past year, despite a significant increase in profits by 536%. Furthermore, the absence of domestic mutual fund investment, which holds 0% of the company, may indicate a lack of confidence in the stock's valuation or business prospects.<BR><BR>In summary, while the stock has seen a minor rise today, the overall trend is downward due to poor performance metrics, declining investor interest, and underwhelming long-term returns compared to benchmarks.

View full answer

Why is Australian Premium Solar (India) Ltd falling/rising?

19-Mar-2026

As of 18-Mar, Australian Premium Solar (India) Ltd's stock price is rising to 307.80, reflecting a 1.58% increase. The stock shows strong fundamentals and recent positive financial results, although it has faced challenges such as a decline in delivery volume and underperformance over the past year.

As of 18-Mar, Australian Premium Solar (India) Ltd's stock price is rising, currently at 307.80, reflecting a change of 4.8 (1.58%) upward. This increase is notable as the stock has outperformed its sector by 0.48% today. Despite a recent decline in delivery volume by 33.33% against the 5-day average, the stock remains liquid enough for trading.<BR><BR>The company exhibits strong fundamentals, with a low debt-to-equity ratio and impressive long-term growth metrics, including a 64.00% annual growth rate in net sales and a 139.84% increase in operating profit. Recent positive financial results, such as a higher profit after tax of Rs 29.10 crore and significant growth in net sales, further bolster investor confidence. <BR><BR>However, it is essential to note that the stock has faced challenges, including a -19.56% return over the past year and underperformance compared to benchmarks like the Sensex. Additionally, the lack of domestic mutual fund investment may indicate some hesitance among institutional investors regarding the stock's valuation or business prospects. Despite these concerns, the current upward movement in the stock price can be attributed to its strong financial performance and positive market sentiment today.

View full answer

Why is Australian Premium Solar (India) Ltd falling/rising?

20-Mar-2026

As of 19-Mar, Australian Premium Solar (India) Ltd's stock price is declining, currently at 301.60, reflecting a 2.01% decrease. The stock has underperformed significantly over the past year and lacks institutional support, contributing to its ongoing downward trend.

As of 19-Mar, Australian Premium Solar (India) Ltd's stock price is falling, currently at 301.60, which reflects a decrease of 6.2 points or 2.01%. This decline is consistent with the company's recent performance, as it has generated a return of -25.36% over the past year, significantly underperforming the benchmark Sensex, which has seen a slight increase of 0.41% during the same period.<BR><BR>The stock's performance over various time frames also indicates a downward trend. For instance, in the last month, the stock has dropped by 10.54%, while the Sensex has only decreased by 9.63%. Additionally, year-to-date, the stock is down 17.92%, compared to the Sensex's decline of 11.97%. This underperformance is compounded by the fact that the stock has consistently traded below its moving averages across multiple time frames, including the 5-day, 20-day, 50-day, 100-day, and 200-day averages.<BR><BR>Despite some positive factors, such as a low debt-to-equity ratio and impressive growth in net sales and operating profit, the overall sentiment appears negative. The stock's poor performance has led to a lack of interest from domestic mutual funds, which hold 0% of the company, suggesting a lack of confidence in its valuation or business prospects. Furthermore, the stock's liquidity is adequate, but the rising investor participation does not seem to be translating into price stability or growth.<BR><BR>In summary, the combination of significant historical losses, underperformance relative to benchmarks, and lack of institutional support contributes to the current decline in Australian Premium Solar (India) Ltd's stock price.

View full answer

Why is Australian Premium Solar (India) Ltd falling/rising?

21-Mar-2026

As of 20-Mar, Australian Premium Solar (India) Ltd's stock price is slightly up at 301.95, but it has significantly underperformed over various time frames, with a year-to-date decline of 17.83% and a 23.24% drop over the past year. The stock is trading below key moving averages and lacks institutional interest, indicating ongoing challenges despite recent profit growth.

As of 20-Mar, Australian Premium Solar (India) Ltd is experiencing a slight increase in its stock price, currently at 301.95, with a change of 0.35 (0.12%) upward. However, despite this minor rise, the stock has shown significant underperformance in both the short and long term. Over the past week, the stock has decreased by 0.82%, and in the last month, it has fallen by 8.31%. Year-to-date, the stock has declined by 17.83%, and over the past year, it has dropped by 23.24%. <BR><BR>The stock's performance today has underperformed the sector by 2.07%, and it is trading below its 5-day, 20-day, 50-day, 100-day, and 200-day moving averages, indicating a bearish trend. Additionally, there has been a notable decrease in investor participation, with delivery volume falling by 16.93% compared to the 5-day average. <BR><BR>While the company has shown healthy long-term growth in net sales and operating profit, with a significant increase in profits over the past year, the stock's valuation is not attracting domestic mutual funds, which hold 0% of the company. This lack of institutional interest may reflect concerns about the stock's price or business fundamentals. Overall, despite a minor uptick in price, the broader context of declining performance metrics and investor sentiment suggests that the stock is still facing challenges.

View full answer

Why is Australian Premium Solar (India) Ltd falling/rising?

24-Mar-2026

As of 23-Mar, Australian Premium Solar (India) Ltd's stock price is Rs 290.55, down 3.78%, with significant declines over various time frames and underperformance compared to the Sensex. The stock is trading below its moving averages and near its 52-week low, reflecting negative sentiment and a lack of institutional investor confidence.

As of 23-Mar, Australian Premium Solar (India) Ltd is experiencing a decline in its stock price, currently at Rs 290.55, which reflects a change of -11.4 or -3.78%. This downward movement is evident in the stock's performance over various time frames, including a 1-week decline of -3.20%, a 1-month drop of -15.02%, and a year-to-date decrease of -20.93%. Additionally, the stock has underperformed the benchmark Sensex, which has seen a smaller decline of -3.83% over the same week.<BR><BR>The stock is also trading lower than its moving averages across multiple periods, including the 5-day, 20-day, 50-day, 100-day, and 200-day averages, indicating a bearish trend. Furthermore, it is close to its 52-week low, being only 3.63% away from Rs 280. <BR><BR>Despite some positive indicators, such as a healthy growth rate in net sales and operating profit, the overall sentiment appears negative. The company has not attracted domestic mutual fund investment, holding only 0% of the company, which may suggest a lack of confidence among institutional investors. This lack of support, combined with the stock's significant underperformance over the past year and its inability to attract a larger investor base, contributes to the current decline in stock price.

View full answer

Why is Australian Premium Solar (India) Ltd falling/rising?

25-Mar-2026

As of 24-Mar, the stock price of Australian Premium Solar (India) Ltd is currently at 300.00, showing a short-term rise of 3.25% amid increased investor interest. However, it has declined significantly year-to-date and over the past year, indicating ongoing long-term challenges.

As of 24-Mar, the stock price of Australian Premium Solar (India) Ltd is rising, currently at 300.00, reflecting a change of 9.45 or 3.25% increase. This upward movement is notable as it outperformed the sector by 1.37% today. Additionally, there has been a significant increase in investor participation, with delivery volume rising by 36.53% compared to the 5-day average, indicating growing interest among investors.<BR><BR>However, it is important to note that despite today's rise, the stock has been underperforming over longer periods. For instance, it has declined by 18.36% year-to-date and 24.55% over the past year. Furthermore, the stock is currently trading below its 5-day, 20-day, 50-day, 100-day, and 200-day moving averages, which suggests a longer-term downward trend. <BR><BR>In summary, while the stock is experiencing a short-term rise due to increased investor activity and sector outperformance, it is still facing significant challenges reflected in its overall performance metrics.

View full answer

Why is Australian Premium Solar (India) Ltd falling/rising?

26-Mar-2026

As of 25-Mar, Australian Premium Solar (India) Ltd's stock price is rising to 303.20, driven by increased investor participation and strong financial performance, including a 64% growth in net sales. However, the stock has declined 22.48% over the past year, indicating potential long-term concerns despite recent positive trends.

As of 25-Mar, Australian Premium Solar (India) Ltd's stock price is rising, currently at 303.20, reflecting a change of 3.2 (1.07%) upwards. This increase can be attributed to several factors. Firstly, there has been a notable rise in investor participation, with a delivery volume of 19.25k on 24 March, which is up by 29.19% compared to the 5-day average. This indicates growing interest and confidence among investors.<BR><BR>Moreover, the company's financial performance shows positive trends, with net sales growing at an annual rate of 64.00% and operating profit increasing by 139.84%. In the latest six-month period, the profit after tax (PAT) was reported at Rs 29.10 crore, and net sales for the quarter reached Rs 153.11 crore, reflecting a growth of 39.5% compared to the previous four-quarter average. Additionally, the company has a low debt-to-equity ratio, which suggests financial stability.<BR><BR>However, it is important to note that despite the current rise, the stock has experienced a significant decline over the past year, with a return of -22.48%. This underperformance, along with the fact that domestic mutual funds hold 0% of the company, may indicate a lack of confidence in the stock's long-term prospects. Nonetheless, the recent positive financial results and increased trading activity may be contributing to the current upward movement in the stock price.

View full answer
iScoreScore
Click here to find our call on this stock
Strong Sell
Sell
Hold
Buy
Strong Buy

Dashboard

1

Despite the size of the company, domestic mutual funds hold only 0% of the company

  • Domestic mutual funds have capability to do in-depth on-the-ground research on companies- their small stake may signify either they are not comfortable at the price or the business
2

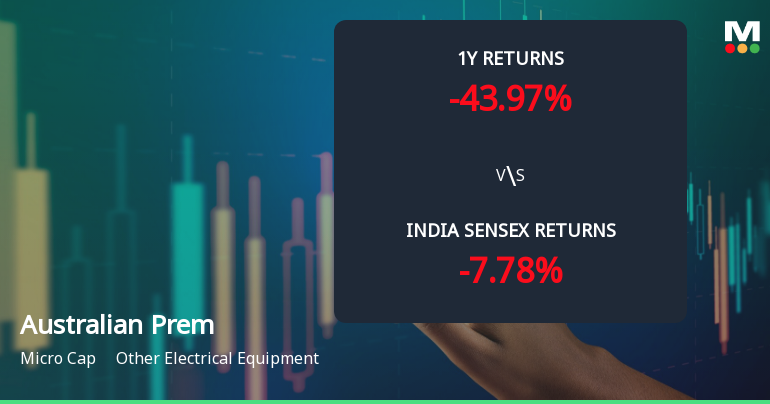
Below par performance in long term as well as near term

stock-summaryMojo Parameters

Mojo Parameters

Loading Valuation Snapshot...

Stock DNA

stock-summary
Industry

Other Electrical Equipment

stock-summary
Market cap

INR 605 Cr (Micro Cap)

stock-summary
P/E

12.00

stock-summary
Industry P/E

62

stock-summary
Dividend Yield

0.03%

stock-summary
Debt Equity

0.06

stock-summary
Return on Equity

29.30%

stock-summary
Price to Book

4.58

Revenue and Profits:
Net Sales:
153 Cr
(Quarterly Results - Jun 2025)
Net Profit:
15 Cr
stock-summaryTotal Returns
Total Returns (Price + Dividend) stock-summary
Dividend Yield (0.03%)
TimePeriod
Price Return
Dividend Return
Total Return
3 Months
-22.45%
0%
-22.45%
6 Months
-36.66%
0.02%
-36.64%
1 Year
-22.4%
0.03%
-22.37%
2 Years
29.86%
0.04%
29.9%
3 Years
0%
0%
0.0%
4 Years
0%
0%
0.0%
5 Years
0%
0%
0.0%

Latest dividend: 0.1 per share ex-dividend date: Nov-07-2025

Risk Adjusted Returns v/s stock-summary
Returns Beta
Icon
Beta has not been calculated since enough price history is not available
stock-summaryNews & Corporate Actions

Announcements stock-summary

Icon
No announcement available

Corporate Actions stock-summary

stock-summary
BOARD MEETING

No Upcoming Board Meetings

stock-summary
DIVIDEND

Australian Premium Solar (India) Ltd has declared 1% dividend, ex-date: 07 Nov 25

stock-summary
SPLITS

No Splits history available

stock-summary
BONUS

No Bonus history available

stock-summary
RIGHTS

No Rights history available

stock-summaryKey Factors

Quality key factors stock-summary

Factor
Value
Sales Growth (5y)
64.00%
EBIT Growth (5y)
139.84%
EBIT to Interest (avg)
14.80
Debt to EBITDA (avg)
0.59
Net Debt to Equity (avg)
0.06
Sales to Capital Employed (avg)
3.04
Tax Ratio
25.70%
Dividend Payout Ratio
0
Pledged Shares
0
Institutional Holding
0.56%
ROCE (avg)
41.83%
ROE (avg)
28.82%

Valuation key factors

Factor
Value
P/E Ratio
12
Industry P/E
0
Price to Book Value
4.32
EV to EBIT
11.32
EV to EBITDA
10.51
EV to Capital Employed
4.14
EV to Sales
1.35
PEG Ratio
0.03
Dividend Yield
0.04%
ROCE (Latest)
36.57%
ROE (Latest)
29.30%

Technicals key factors

Indicator
Weekly
Monthly
MACD
Bearish
RSI
No Signal
No Signal
Bollinger Bands
Bearish
Bearish
Moving Averages
Bearish (Daily)
KST
Mildly Bullish
Dow Theory
Mildly Bullish
Mildly Bearish
OBV
Mildly Bearish
Mildly Bearish
stock-summary Technical Indicator Scale: Bearish, Mildly Bearish, Sideways, Mildly Bullish, Bullish  Turned 
stock-summaryShareholding
Shareholding Snapshot : Sep 2025stock-summary
Shareholding Compare (%holding) stock-summary
Majority shareholders

Promoters

Pledged Promoter Holdings

None

Mutual Funds

Held by 0 Schemes

FIIs

Held by 0 FIIs

Promoter with highest holding

Nikunjkumar Chimanlal Patel (36.91%)

Highest Public shareholder

Nitaben Alpeshbhai Patel (1.54%)

Individual Investors Holdings

24.08%

stock-summaryFinancial
[
  {
    "link": "quarterly",
    "btn_text": "All Quarterly Results",
    "header": "Quarterly Results Snapshot (Standalone) - Jun'25 - QoQ",
    "rhs": [
      {
        "prefix": "Net Sales ",
        "suffix": "QoQ Growth in quarter ended Jun 2025 is 2.64% vs 22.50% in Mar 2025",
        "dir": -1
      },
      {
        "prefix": "Standalone Net Profit ",
        "suffix": "QoQ Growth in quarter ended Jun 2025 is -1.37% vs 28.96% in Mar 2025",
        "dir": -1
      }
    ],
    "table": {
      "header": [
        "Jun'25",
        "Mar'25",
        "Change(%)"
      ],
      "body": [
        {
          "field": "Net Sales",
          "val1": "152.13",
          "val2": "148.22",
          "chgp": "2.64%",
          "chgp_class": "positive"
        },
        {
          "field": "Operating Profit (PBDIT) excl Other Income",
          "val1": "20.80",
          "val2": "19.45",
          "chgp": "6.94%",
          "chgp_class": "positive"
        },
        {
          "field": "Interest",
          "val1": "0.30",
          "val2": "0.39",
          "chgp": "-23.08%",
          "chgp_class": "positive"
        },
        {
          "field": "Exceptional Items",
          "val1": "0.00",
          "val2": "0.00",
          "chgp": "",
          "chgp_class": "neutral"
        },
        {
          "field": "Standalone Net Profit",
          "val1": "14.45",
          "val2": "14.65",
          "chgp": "-1.37%",
          "chgp_class": "negative"
        },
        {
          "field": "Operating Profit Margin (Excl OI)",
          "val1": "13.67%",
          "val2": "13.12%",
          "chgp": "0.55%",
          "chgp_class": "positive"
        }
      ]
    }
  },
  {
    "link": "half-yearly",
    "btn_text": "All Half Yearly Results",
    "alert": "No Half Yearly Results declared by Australian Prem"
  },
  {
    "link": "nine-monthly",
    "btn_text": "All Nine Monthly Results",
    "alert": "No Nine Monthly Results declared by Australian Prem"
  },
  {
    "link": "annual",
    "btn_text": "All Annual Results",
    "alert": "No Annual Results declared by Australian Prem"
  }
]

Quarterly Results Snapshot (Standalone) - Jun'25 - QoQstock-summary

Jun'25
Mar'25
Change(%)
Net Sales
152.13
148.22
2.64%
Operating Profit (PBDIT) excl Other Income
20.80
19.45
6.94%
Interest
0.30
0.39
-23.08%
Exceptional Items
0.00
0.00
Standalone Net Profit
14.45
14.65
-1.37%
Operating Profit Margin (Excl OI)
13.67%
13.12%
0.55%
Values in Rs Cr.
Direction Arrows
Net Sales

QoQ Growth in quarter ended Jun 2025 is 2.64% vs 22.50% in Mar 2025

Direction Arrows
Standalone Net Profit

QoQ Growth in quarter ended Jun 2025 is -1.37% vs 28.96% in Mar 2025

stock-summaryCompany CV
About Australian Premium Solar (India) Ltd stock-summary
stock-summary
Australian Premium Solar (India) Ltd
Micro Cap
Other Electrical Equipment
Australian Premium Solar India Limited was originally incorporated as "Australian Solar Panel (India) Private Limited" vide Certificate of Incorporation dated May 23, 2013 issued by Registrar of Companies, Gujarat, Dadra and Nagar Haveli. Subsequently, name of the company was changed from "Australian Solar Panel (India) Private Limited" to "Australian Premium Solar (India) Private Limited", dated November 28, 2013.
Company Coordinates stock-summary
Icon
No Company Details Available