
Compare Vibhor Steel with Similar Stocks
Stock DNA
Iron & Steel Products
INR 224 Cr (Micro Cap)
21.00
26
0.00%
0.91
5.53%
1.17
Total Returns (Price + Dividend) 
Vibhor Steel for the last several years.
Risk Adjusted Returns v/s
Returns Beta

News
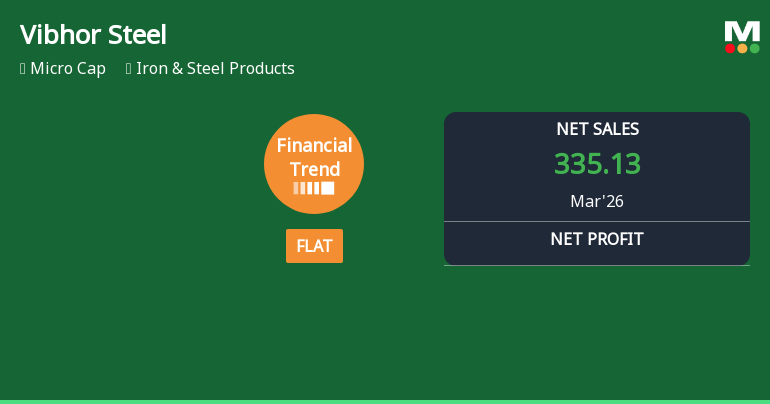
Vibhor Steel Tubes Ltd Reports Stabilised Quarterly Performance Amid Margin Gains
Vibhor Steel Tubes Ltd has reported a flat financial performance for the quarter ended March 2026, marking a notable improvement from its previous negative trend. While revenue and operating profit margins reached new highs, the company continues to grapple with rising interest expenses and a decline in net profit over the latest six months, reflecting a mixed outlook for investors in the iron and steel products sector.
Read full news article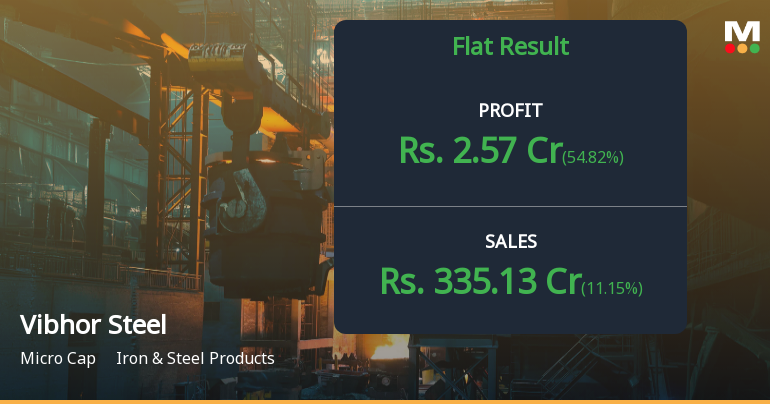
Vibhor Steel Tubes Q4 FY26: Margin Recovery Masks Deeper Profitability Concerns
Vibhor Steel Tubes Ltd., a micro-cap player in India's iron and steel products sector with a market capitalisation of ₹226.00 crores, reported a net profit of ₹2.57 crores for Q4 FY26, marking a sequential increase of 54.82% from Q3 FY26's ₹1.66 crores. However, the year-on-year comparison paints a concerning picture, with profits plunging 42.12% from ₹4.44 crores in Q4 FY25. The stock has reacted negatively to the broader performance narrative, declining 21.24% over the past year and currently trading at ₹119.00, significantly below its 52-week high of ₹207.00.
Read full news article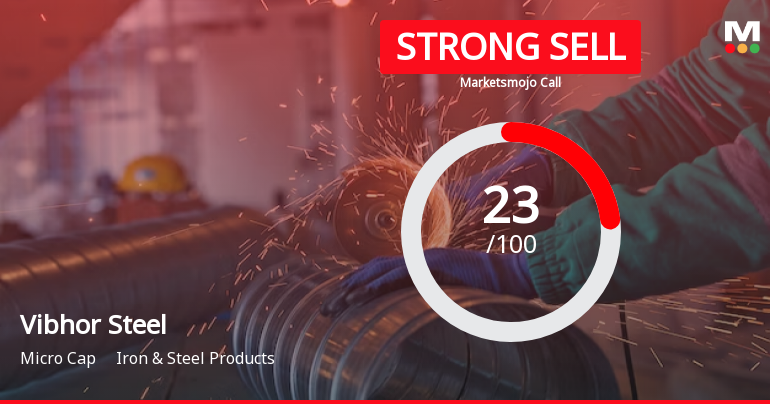
Vibhor Steel Tubes Ltd is Rated Strong Sell
Vibhor Steel Tubes Ltd is rated Strong Sell by MarketsMOJO, with this rating last updated on 01 Sep 2025. However, the analysis and financial metrics discussed here reflect the stock's current position as of 18 May 2026, providing investors with an up-to-date view of the company's fundamentals, valuation, financial trends, and technical outlook.
Read full news article Announcements
Corporate Actions

No Upcoming Board Meetings

No Dividend history available

No Splits history available

No Bonus history available

No Rights history available
Quality key factors
Valuation key factors
Technicals key factors
 Technical Indicator Scale: Bearish, Mildly Bearish, Sideways, Mildly Bullish, Bullish Turned
 Shareholding Snapshot : Mar 2026
Shareholding Compare (%holding)
Promoters
None
Held by 0 Schemes
Held by 2 FIIs (0.31%)
Vijay Laxmi Kaushik (22.83%)
None
21.56%
Quarterly Results Snapshot (Standalone) - Mar'26 - QoQ

QoQ Growth in quarter ended Mar 2026 is 11.15% vs 7.01% in Dec 2025
QoQ Growth in quarter ended Mar 2026 is 54.82% vs 16.90% in Dec 2025
Half Yearly Results Snapshot (Standalone) - Sep'25
Growth in half year ended Sep 2025 is 11.26% vs -13.13% in Sep 2024
Growth in half year ended Sep 2025 is 16.62% vs -54.11% in Sep 2024
Nine Monthly Results Snapshot (Standalone) - Dec'25
YoY Growth in nine months ended Dec 2025 is 14.99% vs -9.40% in Dec 2024
YoY Growth in nine months ended Dec 2025 is -15.26% vs -42.79% in Dec 2024
Annual Results Snapshot (Standalone) - Mar'26
YoY Growth in year ended Mar 2026 is 15.35% vs -7.12% in Mar 2025
YoY Growth in year ended Mar 2026 is -25.32% vs -33.58% in Mar 2025
About Vibhor Steel Tubes Ltd

Company Coordinates


