
Compare VMS TMT with Similar Stocks
Dashboard
High Debt company with Weak Long Term Fundamental Strength
- Poor long term growth as Net Sales has grown by an annual rate of 0% over the last 5 years
- The company is Net-Debt Free
- PBT LESS OI(Q) At Rs 2.95 cr has Fallen at -55.4% (vs previous 4Q average)
- PAT(Q) At Rs 2.29 cr has Fallen at -59.2% (vs previous 4Q average)
- PBDIT(Q) Lowest at Rs 11.69 cr.
Falling Participation by Institutional Investors
Stock DNA
Iron & Steel Products
INR 219 Cr (Micro Cap)
10.00
26
0.00%
0.97
9.22%
0.97
Total Returns (Price + Dividend) 
VMS TMT for the last several years.
Risk Adjusted Returns v/s
Returns Beta

News
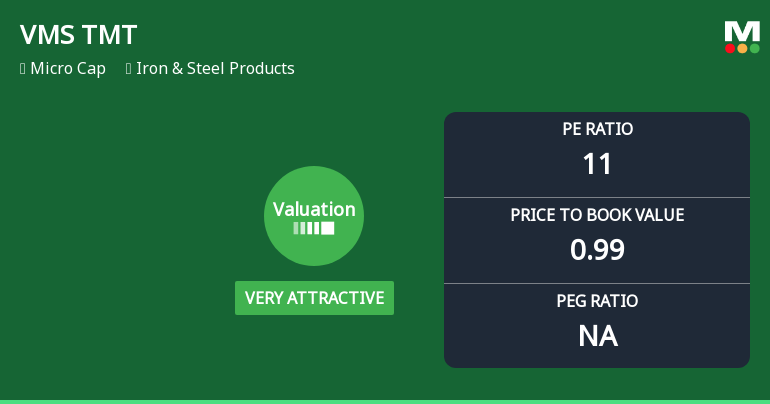
VMS TMT Ltd Valuation Shifts to Very Attractive Amid Market Challenges
VMS TMT Ltd, a micro-cap player in the Iron & Steel Products sector, has seen a notable shift in its valuation parameters, moving from an attractive to a very attractive rating. Despite recent price pressures and underperformance relative to the Sensex, the company’s price-to-earnings (P/E) and price-to-book value (P/BV) ratios now present a compelling case for value investors seeking opportunities in the steel industry.
Read full news article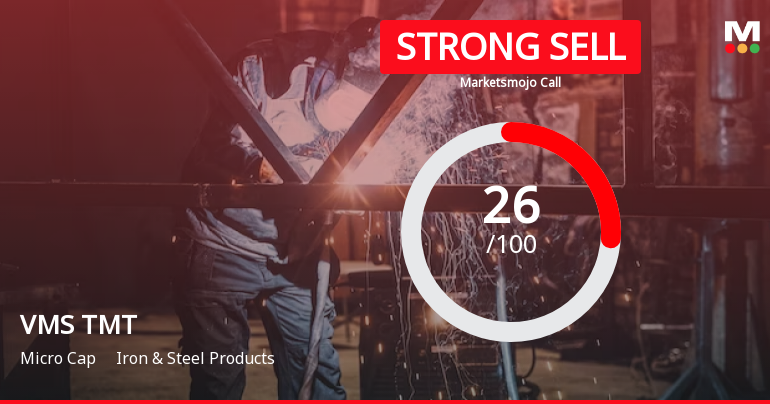
VMS TMT Ltd is Rated Strong Sell
VMS TMT Ltd is rated Strong Sell by MarketsMOJO, with this rating last updated on 08 June 2026. However, the analysis and financial metrics discussed here reflect the company’s current position as of 14 June 2026, providing investors with the most up-to-date insight into the stock’s fundamentals, valuation, financial trends, and technical outlook.
Read full news article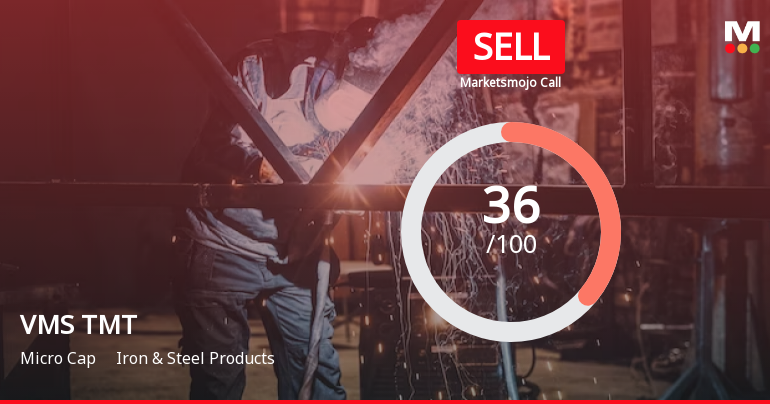
VMS TMT Ltd is Rated Sell by MarketsMOJO
VMS TMT Ltd is rated 'Sell' by MarketsMOJO, with this rating last updated on 01 June 2026. However, the analysis and financial metrics presented here reflect the stock's current position as of 03 June 2026, providing investors with the most up-to-date view of the company's fundamentals, valuation, financial trends, and technical outlook.
Read full news article Announcements
Corporate Actions

No Upcoming Board Meetings

No Dividend history available

No Splits history available

No Bonus history available

No Rights history available
Quality key factors
Valuation key factors
Technicals key factors
 Technical Indicator Scale: Bearish, Mildly Bearish, Sideways, Mildly Bullish, Bullish Turned
 Shareholding Snapshot : Mar 2026
Shareholding Compare (%holding)
Promoters
None
Held by 0 Schemes
Held by 2 FIIs (2.04%)
Rishabh Sunil Singhi (24.21%)
Chanakya Opportunities Fund I (2.06%)
22.5%
Quarterly Results Snapshot (Standalone) - Mar'26 - QoQ

QoQ Growth in quarter ended Mar 2026 is 19.28% vs 10.42% in Dec 2025

QoQ Growth in quarter ended Mar 2026 is -71.52% vs 277.46% in Dec 2025
Half Yearly Results Snapshot (Standalone) - Sep'25
Not Applicable: The company has declared_date for only one period
Not Applicable: The company has declared_date for only one period
Nine Monthly Results Snapshot (Standalone) - Dec'25
Not Applicable: The company has declared_date for only one period
Not Applicable: The company has declared_date for only one period
Annual Results Snapshot (Standalone) - Mar'26
YoY Growth in year ended Mar 2026 is 8.88% vs -11.77% in Mar 2025
YoY Growth in year ended Mar 2026 is 42.67% vs 9.43% in Mar 2025
About VMS TMT Ltd

Company Coordinates


