
Compare Sathlokhar Sys. with Similar Stocks
Dashboard
Despite the size of the company, domestic mutual funds hold only 0.13% of the company
- Domestic mutual funds have capability to do in-depth on-the-ground research on companies- their small stake may signify either they are not comfortable at the price or the business
Below par performance in long term as well as near term
Total Returns (Price + Dividend) 
Sathlokhar Sys. for the last several years.
Risk Adjusted Returns v/s
Returns Beta

News

Sathlokhar Synergys E&C Global Ltd is Rated Sell
Sathlokhar Synergys E&C Global Ltd is rated Sell by MarketsMOJO. This rating was last updated on 29 May 2026, reflecting a new assessment of the stock’s outlook. However, all fundamentals, returns, and financial metrics discussed here are current as of 02 July 2026, providing investors with the latest view of the company’s position in the market.
Read full news article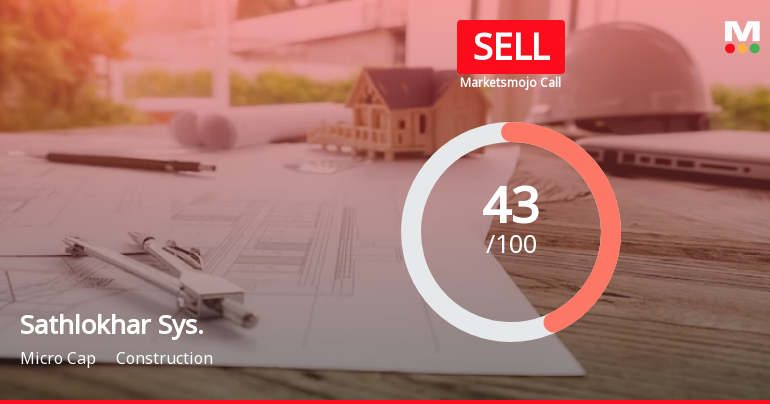
Sathlokhar Synergys E&C Global Ltd is Rated Sell
Sathlokhar Synergys E&C Global Ltd is rated 'Sell' by MarketsMOJO, with this rating last updated on 29 May 2026. However, the analysis and financial metrics discussed below reflect the stock’s current position as of 21 June 2026, providing investors with an up-to-date view of the company’s fundamentals, valuation, financial trend, and technical outlook.
Read full news article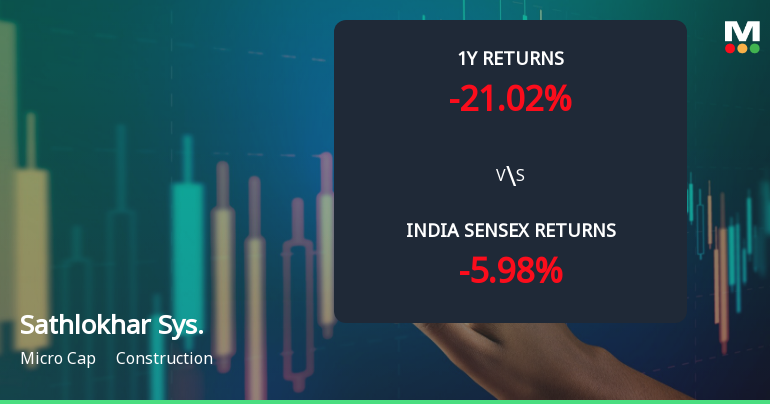
Sathlokhar Synergys E&C Global Ltd Faces Bearish Momentum Amid Technical Downturn
Sathlokhar Synergys E&C Global Ltd, a micro-cap player in the construction sector, has seen a marked shift in its technical momentum, with key indicators signalling a bearish trend. The stock’s recent price action and technical parameters suggest increasing downside risks, contrasting with broader market resilience as reflected by the Sensex.
Read full news article Announcements
Corporate Actions

No Upcoming Board Meetings

No Dividend history available

No Splits history available

No Bonus history available

No Rights history available
Quality key factors
Valuation key factors
Technicals key factors
 Technical Indicator Scale: Bearish, Mildly Bearish, Sideways, Mildly Bullish, Bullish Turned
 Shareholding Snapshot : Mar 2026
Shareholding Compare (%holding)
Promoters
None
Held by 1 Schemes (0.06%)
Held by 4 FIIs (0.28%)
T Sangeethaa (54.32%)
Aparna Samir Thakker (4.12%)
32.03%
Quarterly Results Snapshot (Standalone) - Mar'26 - QoQ

QoQ Growth in quarter ended Mar 2026 is 2.07% vs 39.54% in Dec 2025
QoQ Growth in quarter ended Mar 2026 is 4.38% vs 31.89% in Dec 2025
Half Yearly Results Snapshot (Standalone) - Sep'25
Growth in half year ended Sep 2025 is -3.30% vs 81.50% in Mar 2025
Growth in half year ended Sep 2025 is 6.23% vs 60.12% in Mar 2025
Nine Monthly Results Snapshot (Standalone) - Dec'25
YoY Growth in nine months ended Dec 2025 is 24.21% vs 29.49% in Mar 2026
YoY Growth in nine months ended Dec 2025 is 21.97% vs 36.82% in Mar 2026
Annual Results Snapshot (Standalone) - Mar'26

YoY Growth in year ended Mar 2026 is 121.88% vs 49.69% in Mar 2025
YoY Growth in year ended Mar 2026 is 141.05% vs 30.69% in Mar 2025
About Sathlokhar Synergys E&C Global Ltd

Company Coordinates


