
Compare Vascon Engineers with Similar Stocks
Dashboard
Poor Management Efficiency with a low ROCE of 7.50%
- The company has been able to generate a Return on Capital Employed (avg) of 7.50% signifying low profitability per unit of total capital (equity and debt)
With a fall in PBT of -43.18%, the company declared Very Negative results in Mar 26
Despite the size of the company, domestic mutual funds hold only 0% of the company
Below par performance in long term as well as near term
Total Returns (Price + Dividend) 
Latest dividend: 0.2 per share ex-dividend date: Aug-21-2023
Risk Adjusted Returns v/s
Returns Beta

News

Vascon Engineers Downgraded to Strong Sell Amid Weak Financials and Bearish Technicals
Vascon Engineers Ltd has been downgraded from a Sell to a Strong Sell rating following a comprehensive reassessment of its quality, valuation, financial trends, and technical indicators. The construction sector company’s deteriorating financial performance, coupled with bearish technical signals, has prompted a significant revision in its investment outlook as of 6 July 2026.
Read full news article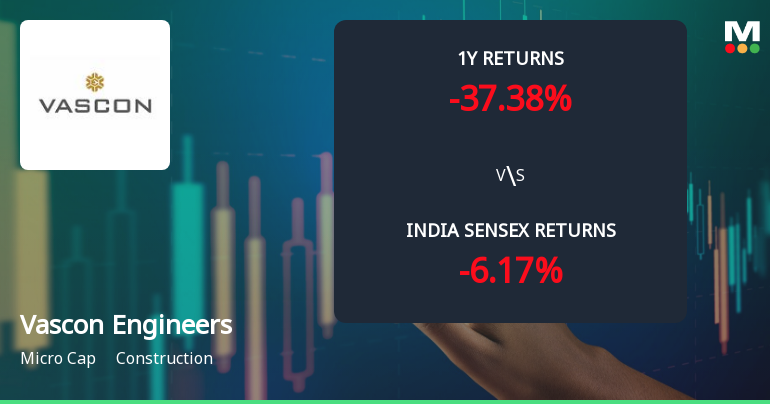
Vascon Engineers Ltd Faces Intensified Bearish Momentum Amid Technical Downgrade
Vascon Engineers Ltd, a micro-cap player in the construction sector, has experienced a notable shift in its technical momentum, prompting a downgrade in its MarketsMOJO grade from Sell to Strong Sell as of 6 July 2026. The stock’s price has weakened amid bearish signals across key technical indicators, reflecting growing investor caution despite sporadic short-term bullish cues.
Read full news article
Vascon Engineers Ltd is Rated Sell
Vascon Engineers Ltd is rated 'Sell' by MarketsMOJO, with this rating last updated on 08 June 2026. However, the analysis and financial metrics discussed here reflect the stock's current position as of 01 July 2026, providing investors with an up-to-date view of the company’s fundamentals, returns, and market performance.
Read full news article Announcements
Vascon Engineers Limited - Updates
18-Nov-2019 | Source : NSEVascon Engineers Limited has informed the Exchange regarding 'Resignation of Statutory Auditors of Material Subsidiary of the Company'.
Vascon Engineers Limited - Analysts/Institutional Investor Meet/Con. Call Updates
01-Nov-2019 | Source : NSEVascon Engineers Limited has informed the Exchange regarding Analysts/Institutional Investor Meet/Con. Call Updates
Vascon Engineers Limited - Outcome of Board Meeting
25-Oct-2019 | Source : NSEVascon Engineers Limited has informed the Exchange regarding Board meeting held on October 24, 2019.
Corporate Actions

No Upcoming Board Meetings

Vascon Engineers Ltd has declared 2% dividend, ex-date: 21 Aug 23

No Splits history available

No Bonus history available

Vascon Engineers Ltd has announced 14:19 rights issue, ex-date: 23 Jun 15
Quality key factors
Valuation key factors
Technicals key factors
 Technical Indicator Scale: Bearish, Mildly Bearish, Sideways, Mildly Bullish, Bullish Turned
 Shareholding Snapshot : Mar 2026
Shareholding Compare (%holding)
Non Institution
None
Held by 0 Schemes
Held by 24 FIIs (0.51%)
Vasudevan Ramamoorthy (in The Capacity Of Managing Trustee) (14.17%)
Santosh Sundararajan (5.23%)
50.11%
Quarterly Results Snapshot (Consolidated) - Mar'26 - QoQ

QoQ Growth in quarter ended Mar 2026 is 1.48% vs 10.53% in Dec 2025
QoQ Growth in quarter ended Mar 2026 is -38.36% vs -18.81% in Dec 2025
Half Yearly Results Snapshot (Consolidated) - Sep'25
Growth in half year ended Sep 2025 is 12.82% vs 28.65% in Sep 2024

Growth in half year ended Sep 2025 is 70.27% vs -38.85% in Sep 2024
Nine Monthly Results Snapshot (Consolidated) - Dec'25
YoY Growth in nine months ended Dec 2025 is 0.78% vs 34.30% in Dec 2024
YoY Growth in nine months ended Dec 2025 is -54.78% vs 86.78% in Dec 2024
Annual Results Snapshot (Consolidated) - Mar'26
YoY Growth in year ended Mar 2026 is -11.93% vs 44.12% in Mar 2025
YoY Growth in year ended Mar 2026 is -62.46% vs 91.71% in Mar 2025
About Vascon Engineers Ltd

Company Coordinates


