
Compare Globale Tessile with Similar Stocks
Dashboard
With a Operating Losses, the company has a Weak Long Term Fundamental Strength
- Poor long term growth as Operating profit has grown by an annual rate -208.01% of over the last 5 years
- Company's ability to service its debt is weak with a poor EBIT to Interest (avg) ratio of -0.38
Flat results in Mar 26
Risky - Negative EBITDA
Below par performance in long term as well as near term
Stock DNA
Garments & Apparels
INR 12 Cr (Micro Cap)
NA (Loss Making)
25
0.00%
0.24
-14.60%
1.21
Total Returns (Price + Dividend) 
Globale Tessile for the last several years.
Risk Adjusted Returns v/s
Returns Beta

News

Globale Tessile Ltd Forms Death Cross, Signalling Potential Bearish Trend
Globale Tessile Ltd, a micro-cap player in the Garments & Apparels sector, has recently formed a Death Cross as its 50-day moving average (DMA) crossed below the 200-DMA, marking a significant bearish technical signal. This development underscores a deterioration in the stock’s trend and raises concerns about its long-term weakness amid already challenging fundamentals and sectoral headwinds.
Read full news article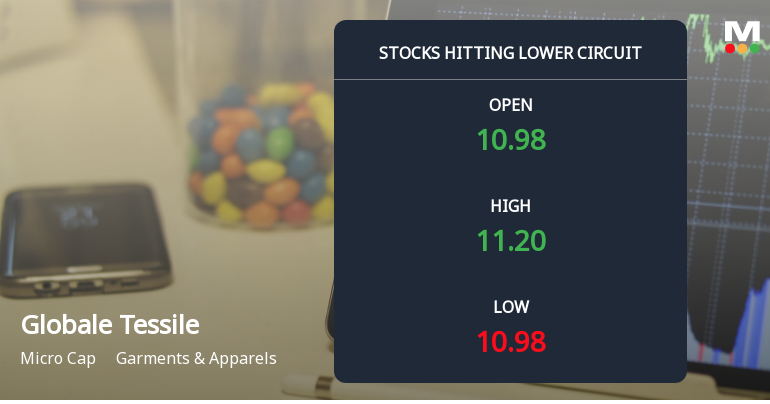
Globale Tessile Ltd Locks at Lower Circuit With 1.43% Loss — Sellers Queue, No Buyers in Sight
At Rs 10.60, sellers were still queuing — but there were no buyers willing to take the other side. Globale Tessile Ltd locked at its lower circuit of 5% on 13 Jul 2026, with unfilled sell orders and a frozen price, signalling persistent selling pressure in a micro-cap stock with limited liquidity.
Read full news article
Globale Tessile Ltd Locks at Lower Circuit With 4.76% Loss — Sellers Queue, No Buyers in Sight
At Rs 11.45, sellers were still queuing — but there were no buyers willing to take the other side. Globale Tessile Ltd locked at its lower circuit of 4.76% on 10 Jul 2026, with unfilled sell orders and a frozen price, signalling a pronounced imbalance between supply and demand in this micro-cap stock.
Read full news article Announcements
Corporate Actions

No Upcoming Board Meetings

No Dividend history available

No Splits history available

No Bonus history available

No Rights history available
Quality key factors
Valuation key factors
Technicals key factors
 Technical Indicator Scale: Bearish, Mildly Bearish, Sideways, Mildly Bullish, Bullish Turned
 Shareholding Snapshot : Jun 2026
Shareholding Compare (%holding)
Promoters
None
Held by 1 Schemes (0.07%)
Held by 1 FIIs (0.07%)
Rahul Jeetmal Parekh (17.3%)
Investor Education And Protection Fund Authority Ministry Of Corporate Affairs (1.66%)
26.2%
Quarterly Results Snapshot (Standalone) - Mar'26 - QoQ

QoQ Growth in quarter ended Mar 2026 is 211.20% vs -5.82% in Dec 2025
QoQ Growth in quarter ended Mar 2026 is -10.81% vs -42.31% in Dec 2025
Half Yearly Results Snapshot (Standalone) - Sep'25

Growth in half year ended Sep 2025 is -89.61% vs 3.73% in Sep 2024
Growth in half year ended Sep 2025 is -191.18% vs -22.73% in Sep 2024
Nine Monthly Results Snapshot (Standalone) - Dec'25
YoY Growth in nine months ended Dec 2025 is -86.85% vs 11.09% in Dec 2024
YoY Growth in nine months ended Dec 2025 is -682.35% vs -80.46% in Dec 2024
Annual Results Snapshot (Standalone) - Mar'26
YoY Growth in year ended Mar 2026 is -70.58% vs -9.56% in Mar 2025
YoY Growth in year ended Mar 2026 is -81.82% vs -254.00% in Mar 2025
About Globale Tessile Ltd

Company Coordinates


