
Compare Manba Finance with Similar Stocks
Stock DNA
Non Banking Financial Company (NBFC)
INR 586 Cr (Micro Cap)
14.00
22
0.78%
3.78
10.87%
1.50
Total Returns (Price + Dividend) 
Latest dividend: 0.2 per share ex-dividend date: Feb-06-2026
Risk Adjusted Returns v/s
Returns Beta

News
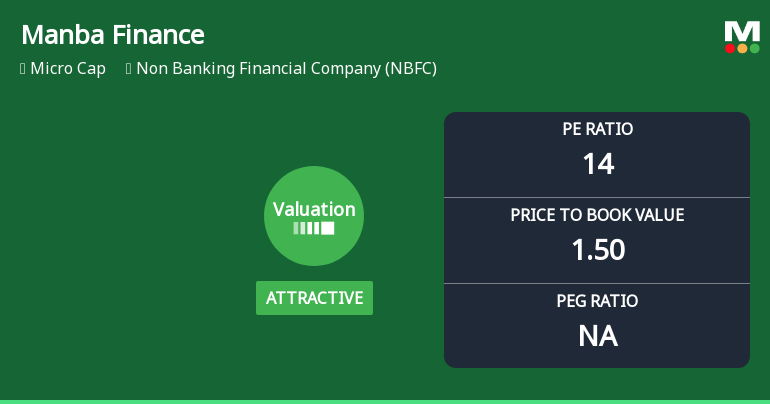
Manba Finance Ltd Valuation Improves Amid Mixed Returns and Sector Comparison
Manba Finance Ltd, a micro-cap player in the Non Banking Financial Company (NBFC) sector, has witnessed a notable improvement in its valuation parameters, shifting from very attractive to attractive territory. Despite a challenging year-to-date return of -18.11%, the company’s price-to-earnings (P/E) and price-to-book value (P/BV) ratios suggest a more compelling entry point relative to its historical averages and peer group, warranting a closer examination for investors seeking value in the NBFC space.
Read full news article
Manba Finance Ltd Technical Momentum Shifts Amid Mixed Market Signals
Manba Finance Ltd, a micro-cap player in the Non Banking Financial Company (NBFC) sector, has exhibited a subtle shift in its technical momentum, moving from a bearish stance to a mildly bearish outlook. Despite a recent day gain of 1.86%, the stock’s broader technical indicators present a complex picture, reflecting both cautious optimism and lingering bearish pressures.
Read full news article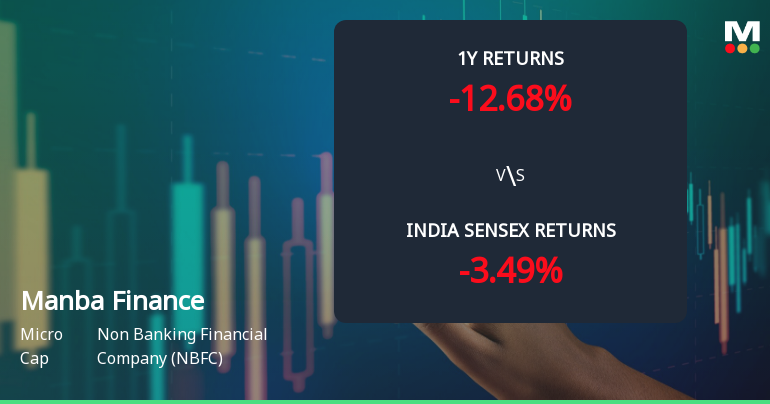
Manba Finance Ltd Technical Momentum Shifts Amid Bearish Signals
Manba Finance Ltd, a micro-cap player in the Non Banking Financial Company (NBFC) sector, has experienced a notable shift in its technical momentum, moving from a mildly bearish to a bearish trend. Despite a stable closing price of ₹108.55, a detailed analysis of key technical indicators such as MACD, RSI, moving averages, and Bollinger Bands reveals a cautious outlook for investors amid broader market pressures and subdued price action.
Read full news article Announcements
Corporate Actions

18 May 2026

Manba Finance Ltd has declared 2% dividend, ex-date: 06 Feb 26

No Splits history available

No Bonus history available

No Rights history available
Quality key factors
Valuation key factors
Technicals key factors
 Technical Indicator Scale: Bearish, Mildly Bearish, Sideways, Mildly Bullish, Bullish Turned
 Shareholding Snapshot : Mar 2026
Shareholding Compare (%holding)
Promoters
None
Held by 0 Schemes
Held by 4 FIIs (0.87%)
Manba Investments & Securities Pvt Ltd (27.68%)
Chartered Finance & Leasing Limited (1.68%)
18.21%
Quarterly Results Snapshot (Standalone) - Dec'25 - QoQ

QoQ Growth in quarter ended Dec 2025 is 16.55% vs 14.74% in Sep 2025

QoQ Growth in quarter ended Dec 2025 is 14.74% vs 16.92% in Sep 2025
Half Yearly Results Snapshot (Standalone) - Sep'25
Growth in half year ended Sep 2025 is 27.74% vs 43.16% in Sep 2024
Growth in half year ended Sep 2025 is 25.74% vs 1.57% in Sep 2024
Nine Monthly Results Snapshot (Standalone) - Dec'25
YoY Growth in nine months ended Dec 2025 is 28.95% vs 7.60% in Dec 2024
YoY Growth in nine months ended Dec 2025 is 14.94% vs 0.47% in Dec 2024
Annual Results Snapshot (Standalone) - Mar'25
YoY Growth in year ended Mar 2025 is 40.73% vs 34.73% in Mar 2024
YoY Growth in year ended Mar 2025 is 21.23% vs 88.06% in Mar 2024
About Manba Finance Ltd

Company Coordinates


