
Compare Ventive Hospital with Similar Stocks
Dashboard
Poor Management Efficiency with a low ROCE of 8.62%
- The company has been able to generate a Return on Capital Employed (avg) of 8.62% signifying low profitability per unit of total capital (equity and debt)
41.06% of Promoter Shares are Pledged
Below par performance in long term as well as near term
Stock DNA
Hotels & Resorts
INR 14,558 Cr (Small Cap)
34.00
39
0.00%
0.38
7.84%
2.65
Total Returns (Price + Dividend) 
Ventive Hospital for the last several years.
Risk Adjusted Returns v/s
Returns Beta

News

Ventive Hospitality Ltd Valuation Shifts Signal Changing Market Sentiment
Ventive Hospitality Ltd has experienced a notable shift in its valuation parameters, moving from an expensive to a fair valuation grade. This change reflects evolving market perceptions amid a challenging sector backdrop, with key metrics such as the price-to-earnings (P/E) and price-to-book value (P/BV) ratios adjusting relative to historical averages and peer comparisons.
Read full news article
Ventive Hospitality Ltd is Rated Hold
Ventive Hospitality Ltd is rated 'Hold' by MarketsMOJO, with this rating last updated on 29 June 2026. However, the analysis and financial metrics discussed here reflect the company’s current position as of 30 June 2026, providing investors with the latest insights into its performance and outlook.
Read full news article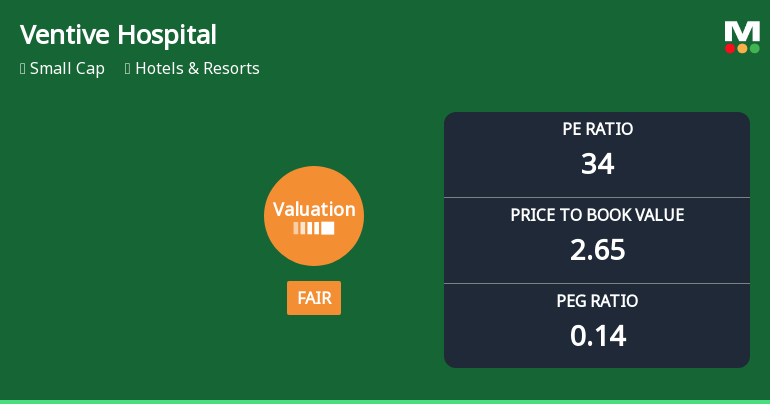
Ventive Hospitality Ltd Valuation Shifts to Fair; Market Performance Lags Sensex
Ventive Hospitality Ltd has witnessed a notable shift in its valuation parameters, moving from an expensive to a fair valuation grade, reflecting a recalibration in investor sentiment amid a challenging market backdrop for the Hotels & Resorts sector. This transition is underscored by changes in key metrics such as the price-to-earnings (P/E) and price-to-book value (P/BV) ratios, positioning the company more attractively relative to its peers and historical averages.
Read full news article Announcements
Corporate Actions

No Upcoming Board Meetings

No Dividend history available

No Splits history available

No Bonus history available

No Rights history available
Quality key factors
Valuation key factors
Technicals key factors
 Technical Indicator Scale: Bearish, Mildly Bearish, Sideways, Mildly Bullish, Bullish Turned
 Shareholding Snapshot : Mar 2026
Shareholding Compare (%holding)
Promoters
41.0628
Held by 5 Schemes (5.16%)
Held by 21 FIIs (1.42%)
Premsagar Infra Realty Private Limited (37.28%)
Quant Mutual Fund-quant Elss Tax Saver Fund (4.99%)
2.58%
Quarterly Results Snapshot (Consolidated) - Mar'26 - QoQ

QoQ Growth in quarter ended Mar 2026 is 13.61% vs 40.09% in Dec 2025
QoQ Growth in quarter ended Mar 2026 is 96.84% vs 121.82% in Dec 2025
Half Yearly Results Snapshot (Standalone) - Sep'25
Not Applicable: The company has declared_date for only one period
Not Applicable: The company has declared_date for only one period
Nine Monthly Results Snapshot (Standalone) - Dec'25
YoY Growth in nine months ended Dec 2025 is 16.07% vs 31.22% in Dec 2024

YoY Growth in nine months ended Dec 2025 is 108.40% vs 7.45% in Dec 2024
Annual Results Snapshot (Consolidated) - Mar'26
YoY Growth in year ended Mar 2026 is 53.36% vs 235.73% in Mar 2025
YoY Growth in year ended Mar 2026 is 253.85% vs -27.68% in Mar 2025
About Ventive Hospitality Ltd

Company Coordinates


