
Compare Lemon Tree Hotel with Similar Stocks
Dashboard
Low ability to service debt as the company has a high Debt to EBITDA ratio of 2.90 times
- Low ability to service debt as the company has a high Debt to EBITDA ratio of 2.90 times
With ROCE of 17.1, it has a Expensive valuation with a 3.5 Enterprise value to Capital Employed
Below par performance in long term as well as near term
Stock DNA
Hotels & Resorts
INR 9,528 Cr (Small Cap)
37.00
39
0.00%
1.32
18.29%
6.82
Total Returns (Price + Dividend) 
Lemon Tree Hotel for the last several years.
Risk Adjusted Returns v/s
Returns Beta

News
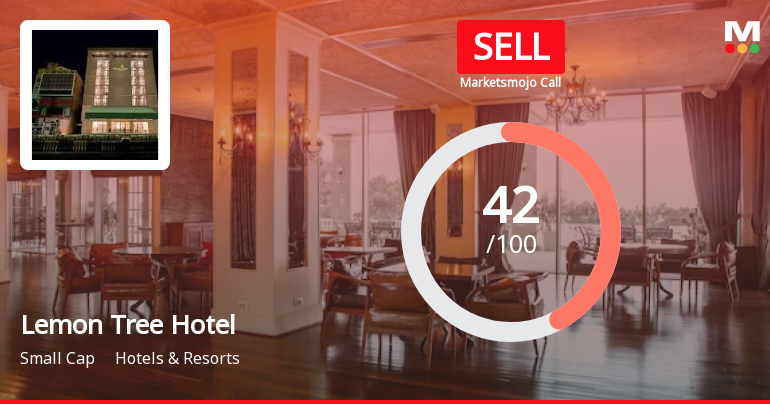
Lemon Tree Hotels Ltd is Rated Sell
Lemon Tree Hotels Ltd is rated Sell by MarketsMOJO, with this rating last updated on 19 January 2026. However, the analysis and financial metrics discussed below reflect the stock's current position as of 30 June 2026, providing investors with an up-to-date view of the company’s fundamentals, returns, and market standing.
Read full news article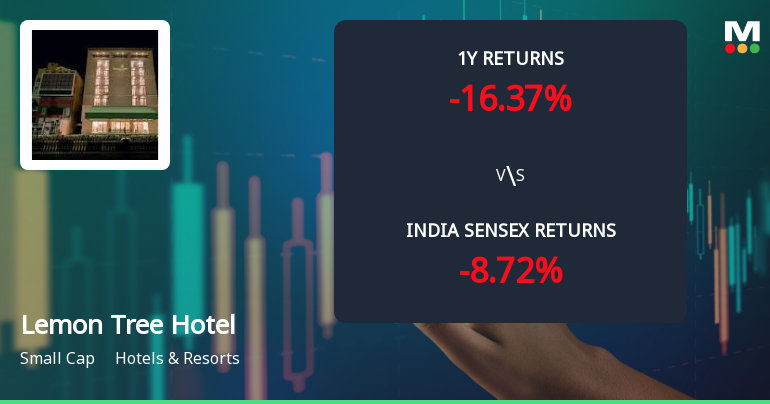
Lemon Tree Hotels Ltd Technical Momentum Shifts Amid Bearish Signals
Lemon Tree Hotels Ltd has experienced a notable shift in its technical momentum, with recent indicators signalling a transition from a sideways trend to a mildly bearish outlook. Despite some mildly bullish weekly signals, the overall technical landscape suggests caution for investors as the stock faces downward pressure amid broader market challenges.
Read full news article
Lemon Tree Hotels Ltd Technical Momentum Shifts Amid Mixed Market Signals
Lemon Tree Hotels Ltd has experienced a notable shift in its technical momentum, moving from a mildly bearish stance to a sideways trend, reflecting a complex interplay of bullish and bearish signals across key technical indicators. Despite a modest day change of 0.13%, the stock’s technical profile reveals nuanced insights for investors navigating the Hotels & Resorts sector.
Read full news article Announcements
Lemon Tree Hotels Limited - Analysts/Institutional Investor Meet/Con. Call Updates
15-Nov-2019 | Source : NSELemon Tree Hotels Limited has informed the Exchange regarding Analysts/Institutional Investor Meet/Con. Call Updates
Lemon Tree Hotels Limited - Outcome of Board Meeting
14-Nov-2019 | Source : NSELemon Tree Hotels Limited has informed the Exchange regarding Board meeting held on November 13, 2019.
Lemon Tree Hotels Limited - Acquisition
04-Nov-2019 | Source : NSELemon Tree Hotels Limited has informed the Exchange about update on the Acquisition under Regulation 30 (9) of SEBI (LODR) Regulations, 2015.
Corporate Actions

No Upcoming Board Meetings

No Dividend history available

No Splits history available

No Bonus history available

No Rights history available
Quality key factors
Valuation key factors
Technicals key factors
 Technical Indicator Scale: Bearish, Mildly Bearish, Sideways, Mildly Bullish, Bullish Turned
 Shareholding Snapshot : Mar 2026
Shareholding Compare (%holding)
Non Institution
None
Held by 23 Schemes (14.91%)
Held by 171 FIIs (21.6%)
Spank Management Services Private Limited (21.12%)
Apg Strategic Real Estate Pool N.v. (14.99%)
20.48%
Quarterly Results Snapshot (Consolidated) - Mar'26 - YoY

YoY Growth in quarter ended Mar 2026 is 10.01% vs 15.65% in Mar 2025
YoY Growth in quarter ended Mar 2026 is 8.09% vs 26.37% in Mar 2025
Half Yearly Results Snapshot (Consolidated) - Sep'25
Growth in half year ended Sep 2025 is 12.61% vs 22.90% in Sep 2024

Growth in half year ended Sep 2025 is 47.48% vs 7.24% in Sep 2024
Nine Monthly Results Snapshot (Consolidated) - Dec'25
YoY Growth in nine months ended Dec 2025 is 13.28% vs 22.71% in Dec 2024
YoY Growth in nine months ended Dec 2025 is 21.14% vs 37.33% in Dec 2024
Annual Results Snapshot (Consolidated) - Mar'26
YoY Growth in year ended Mar 2026 is 12.32% vs 20.07% in Mar 2025
YoY Growth in year ended Mar 2026 is 15.53% vs 32.39% in Mar 2025
About Lemon Tree Hotels Ltd

Company Coordinates


