Rajratan Global

  • Market Cap: Small Cap
  • Industry: Auto Components & Equipments
  • ISIN: INE451D01029
  • NSEID: RAJRATAN
  • BSEID: 517522
INR
499.90
9.45 (1.93%)
BSENSE

Sep 03, 09:44 AM

BSE+NSE Vol: 26.38 k

  • Price Points
  • Score
  • Mojo Parameters
  • Total Return
  • News and Corporate Actions
  • Key factors
  • Shareholding
  • Financials
  • CompanyCV
stock-summaryPrice Point
High/Low

1Day

52 Week

Valuation
Technical
Day's Volume

CASH

26.38 k (140.52%) Volume

Shareholding (Jun 2026)

FII

0.83%

Held by 23 FIIs

DII

8.35%

Held by 9 DIIs

Promoter

65.20%

Why is Rajratan Global Wire Ltd falling/rising?

03-Sep-2026

As of 02-Sep, Rajratan Global Wire Ltd's stock is at 490.85, down 1.35% over the last two days. Despite recent declines, it has a year-to-date increase of 5.68% and strong past performance, but faces long-term growth concerns.

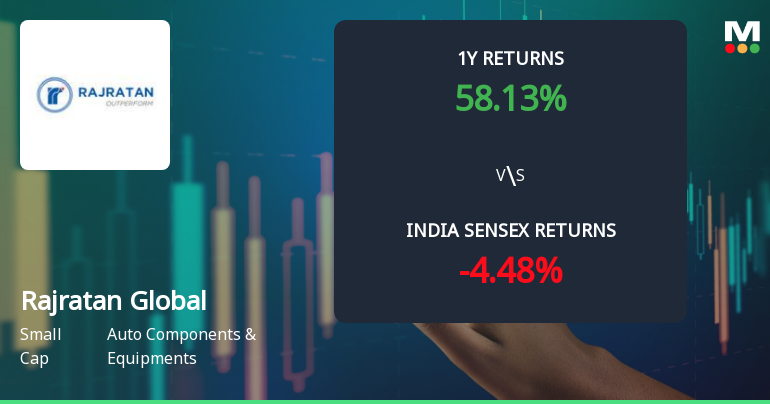
As of 02-Sep, Rajratan Global Wire Ltd's stock price is currently at 490.85, reflecting a decline of 6.7 points or 1.35%. The stock has been experiencing a consecutive fall over the last two days, resulting in a total drop of 1.6% during this period. Despite this recent downturn, the stock has outperformed its sector by 0.42% today.<BR><BR>In terms of performance over different time frames, the stock has shown a year-to-date increase of 5.68%, significantly outperforming the Sensex, which has declined by 10.15% during the same period. Over the past year, Rajratan Global Wire Ltd has generated a remarkable return of 58.13%, far exceeding the market's return of 1.82%. However, the stock's performance over the last three years has been less favorable, with a decline of 34.14%, contrasting with the Sensex's gain of 17.10%.<BR><BR>The stock's current price is above its 50-day, 100-day, and 200-day moving averages but below its 5-day and 20-day moving averages, indicating mixed signals regarding its short-term momentum. Additionally, there has been a notable increase in investor participation, with delivery volume rising by 47.03% against the 5-day average, suggesting a growing interest in the stock despite its recent price decline.<BR><BR>While the company has demonstrated strong financial metrics, such as a high return on capital employed (ROCE) of 20.26% and a low debt-to-EBITDA ratio of 2.31 times, concerns about long-term growth persist. The annual growth rates for net sales and operating profit over the last five years have been relatively modest at 13.09% and 2.82%, respectively. This could contribute to the stock's current valuation challenges, as it is considered expensive relative to its historical averages.<BR><BR>In summary, Rajratan Global Wire Ltd's stock is currently falling due to recent price declines and concerns over long-term growth, despite its strong performance in the past year and rising investor interest.

View full answer

Which are the latest news on Rajratan Global?

02-Sep-2026

Who are in the management team of Rajratan Global?

01-Sep-2026

The management team of Rajratan Global includes Sunil Chordia (Chairman & Managing Director), Abhishek Dalmia (Director), Yashovardhan Chordia (Executive Director), Shubham Jain (Company Secretary & Compliance Officer), and independent directors Rajesh Mittal, Sanjeev Sood, and Alka Arora. They oversee the company's operations and strategic direction.

The management team of Rajratan Global includes the following members:<BR><BR>1. **Sunil Chordia** - Chairman & Managing Director<BR>2. **Abhishek Dalmia** - Director<BR>3. **Yashovardhan Chordia** - Executive Director<BR>4. **Shubham Jain** - Company Secretary & Compliance Officer<BR>5. **Rajesh Mittal** - Independent Director<BR>6. **Sanjeev Sood** - Independent Director<BR>7. **Alka Arora** - Independent Director<BR><BR>This team is responsible for overseeing the company's operations and strategic direction.

View full answer

What does Rajratan Global do?

01-Sep-2026

Rajratan Global Wire Ltd manufactures and sells tyre bead wire, operating in the Auto Components industry as a small-cap company with a market cap of INR 2,484 Cr. As of June 2026, it reported net sales of 318 Cr and a net profit of 23 Cr.

Overview: <BR>Rajratan Global Wire Ltd is engaged in the manufacturing and sale of tyre bead wire and operates within the Auto Components & Equipments industry, classified as a small-cap company.<BR><BR>History: <BR>The company was incorporated in an unspecified year and operates a wholly owned subsidiary, M/s. Rajratan Thai Wire Company Limited. The latest quarterly results reported are for June 2026, showing net sales and profit figures.<BR><BR>Financial Snapshot: <BR>Most recent Net Sales: 318 Cr (Quarterly Results - Jun 2026) <BR>Most recent Net Profit: 23 Cr (Quarterly Results - Jun 2026) <BR>Market-cap value: INR 2,484 Cr (Small Cap)<BR><BR>Key Metrics: <BR>P/E: 32.00 <BR>Industry P/E: 41 <BR>Dividend Yield: 0.40% <BR>Debt-Equity: 0.44 <BR>Return on Equity: 10.79% <BR>Price to Book: 3.87 <BR><BR>Contact Details: <BR>Address: Rajratan House, 11/2 Meera Path Dhenu Market Indore Madhya Pradesh : 452003 <BR>Tel: 91-0731-2546401 <BR>Email: investor-cell@rgwl.co.in <BR>Website: http://www.rajratan.co.in

View full answer

Who are the peers of the Rajratan Global?

01-Sep-2026

Rajratan Global's peers include Federal-Mogul Go, MM Forgings, Sundaram Clayton, and others. Rajratan Global has good management risk and capital structure, with a 1-year return of 60.08%, while MM Forgings leads with 105.71% return.

Peers: The peers of Rajratan Global are Federal-Mogul Go, MM Forgings, Sundaram Clayton, Automotive Axles, Talbros Auto., India Nipp.Elec., GNA Axles, Sar Auto Prod., RACL Geartech, and Rico Auto Inds.<BR><BR>Quality Snapshot: Excellent management risk is observed at Automotive Axles and GNA Axles, while Good management risk is found at Rajratan Global. Average management risk is present at Federal-Mogul Go, MM Forgings, Talbros Auto., India Nipp.Elec., RACL Geartech, and Rico Auto Inds, and the rest. Below Average management risk is noted at Sundaram Clayton and Sar Auto Prod. Growth ratings show that Automotive Axles has Average growth, while Rajratan Global, Federal-Mogul Go, MM Forgings, Sundaram Clayton, Talbros Auto., India Nipp.Elec., GNA Axles, and Rico Auto Inds have Below Average growth, and the rest. Good capital structure is seen at Rajratan Global, Automotive Axles, Talbros Auto., GNA Axles, and the rest, while Excellent capital structure is noted at Federal-Mogul Go and India Nipp.Elec., and Average capital structure is found at MM Forgings, while Below Average capital structure is present at Sundaram Clayton, Sar Auto Prod., RACL Geartech, and Rico Auto Inds.<BR><BR>Return Snapshot: The peer with the highest 1-year return is MM Forgings at 105.71%, while Sundaram Clayton has the lowest at -21.39%. Rajratan Global's 1-year return is 60.08%, which is significantly higher than Sundaram Clayton but lower than MM Forgings. Additionally, Sundaram Clayton and Automotive Axles have negative six-month returns.

View full answer

How big is Rajratan Global?

01-Sep-2026

As of 31st August, Rajratan Global Wire Ltd has a market capitalization of 2,484.00 Cr, with recent Net Sales of 1,228.34 Cr and a Net Profit of 79.63 Cr. The company reported Shareholder's Funds of 650.44 Cr and Total Assets of 1,159.00 Cr for the latest annual period ending in March 2026.

As of 31st August, Rajratan Global Wire Ltd has a market capitalization of 2,484.00 Cr, categorizing it as a Small Cap company.<BR><BR>In the latest four quarters, Rajratan Global reported Net Sales of 1,228.34 Cr and a Net Profit of 79.63 Cr.<BR><BR>For the latest annual period ending in March 2026, the company had Shareholder's Funds amounting to 650.44 Cr and Total Assets of 1,159.00 Cr.

View full answer

Are Rajratan Global Wire Ltd latest results good or bad?

25-Jul-2026

Rajratan Global Wire Ltd's latest Q1 FY27 results are positive, with a net profit of ₹22.96 crores, up 69.82% year-on-year, and record revenue of ₹318.35 crores, a 29.14% increase. However, operating margins have declined to 13.1%, indicating potential challenges that investors should monitor.

Rajratan Global Wire Ltd's latest results for Q1 FY27 can be characterized as positive overall. The company reported a net profit of ₹22.96 crores, which reflects a substantial increase of 69.82% year-on-year and a 48.80% rise compared to the previous quarter. Additionally, revenue grew by 29.14% year-on-year, reaching ₹318.35 crores, marking the highest quarterly sales in the company's history.<BR><BR>However, while the revenue and profit figures are impressive, there are some concerns regarding operating margins. The operating margin for Q1 FY27 was 13.1%, which, although improved from the previous year, shows a decline from the margins achieved in the preceding quarters. This suggests potential pressures from rising input costs or competitive pricing challenges that investors should monitor closely.<BR><BR>Overall, the strong profit growth and revenue momentum indicate a solid performance, but the margin compression highlights areas that require attention. Investors may want to keep an eye on how the company manages these challenges moving forward.

View full answer

Should I buy, sell or hold Rajratan Global Wire Ltd?

25-Jul-2026

When is the next results date for Rajratan Global Wire Ltd?

16-Apr-2026

The next results date for Rajratan Global Wire Ltd is April 21, 2026.

The next results date for Rajratan Global Wire Ltd is scheduled for April 21, 2026.

View full answer

Is Rajratan Global technically bullish or bearish?

03-Dec-2025

As of December 2, 2025, the trend is mildly bullish with supportive indicators like the weekly MACD and daily moving averages, but caution is advised due to bearish signals from the monthly Bollinger Bands and weekly OBV.

As of 2 December 2025, the technical trend has changed from bullish to mildly bullish. The current stance is mildly bullish, supported by the weekly MACD and KST both indicating bullish momentum. The daily moving averages also reflect a bullish trend. However, the monthly Bollinger Bands are mildly bearish, and the OBV shows a mildly bearish signal on the weekly timeframe. Overall, while there are some bullish indicators, the presence of bearish signals in other areas suggests caution.

View full answer

How has been the historical performance of Rajratan Global?

01-Dec-2025

Rajratan Global has experienced steady revenue growth, with net sales increasing from 480.21 Cr in Mar'20 to 935.25 Cr in Mar'25, but profitability has declined, with profit after tax dropping from 100.13 Cr in Mar'23 to 58.80 Cr in Mar'25. Despite rising total assets, challenges in operating profit and cash flow have impacted overall financial performance.

Answer:<BR>The historical performance of Rajratan Global shows a mixed trend in financial metrics over the years.<BR><BR>Breakdown:<BR>Rajratan Global's net sales have shown a steady increase, rising from 480.21 Cr in Mar'20 to 935.25 Cr in Mar'25, with a slight dip in Mar'23. Total operating income followed a similar pattern, reaching 935.25 Cr in Mar'25. However, total expenditure also increased, from 412.19 Cr in Mar'20 to 808.29 Cr in Mar'25, impacting the operating profit, which decreased from 165.26 Cr in Mar'23 to 128.64 Cr in Mar'25. Profit before tax peaked at 130.35 Cr in Mar'23 but fell to 77.36 Cr by Mar'25, while profit after tax also declined from 100.13 Cr in Mar'23 to 58.80 Cr in Mar'25. The company's total assets grew significantly from 378.07 Cr in Mar'20 to 959.56 Cr in Mar'25, alongside total liabilities which increased from 136.70 Cr to 237.49 Cr in the same period. Cash flow from operating activities decreased from 159.00 Cr in Mar'23 to 56.00 Cr in Mar'25, although the net cash inflow improved to 7.00 Cr in Mar'25 from 0.00 Cr in Mar'24. Overall, while Rajratan Global has expanded its revenue and assets, profitability has faced challenges in recent years.

View full answer

Is Rajratan Global overvalued or undervalued?

20-Nov-2025

As of November 19, 2025, Rajratan Global is considered undervalued with a PE ratio of 39.17 and strong growth potential, despite recent stock performance trailing the Sensex, but has delivered a remarkable 415.69% return over the past five years.

As of 19 November 2025, Rajratan Global's valuation grade has moved from expensive to attractive, indicating a positive shift in its market perception. The company is currently considered undervalued, with a PE ratio of 39.17, an EV to EBITDA of 20.16, and a PEG ratio of 0.00, suggesting strong growth potential relative to its price. <BR><BR>In comparison to its peers, Rajratan Global's PE ratio is higher than Samvardhana Motherson's 34.94 but lower than Bosch's 47.82, while its EV to EBITDA is more favorable than Bosch's 43.06. Despite recent stock performance trailing the Sensex, particularly over the past year with a decline of 11.54% compared to the Sensex's 9.81% gain, the long-term outlook remains strong, evidenced by a remarkable 415.69% return over the past five years.

View full answer

Who are the top shareholders of the Rajratan Global?

17-Jul-2025

The top shareholders of Rajratan Global include Rajratan Investments Pvt Limited with 18.44%, individual investors with 23.54%, and SBI Small Cap Fund as the highest public shareholder at 7.39%. Promoters and individual investors significantly influence the company's shareholding structure.

The top shareholders of Rajratan Global include several key players. The majority of the shares are held by promoters, with Rajratan Investments Pvt Limited being the largest individual shareholder at 18.44%. Additionally, individual investors collectively hold 23.54% of the shares. <BR><BR>In terms of institutional investors, two mutual fund schemes hold a combined 7.73%, while foreign institutional investors (FIIs) have a smaller stake of 0.21% through 17 different entities. The highest public shareholder is SBI Small Cap Fund, which holds 7.39%. <BR><BR>Overall, the promoter group and individual investors play significant roles in the company's shareholding structure.

View full answer

What is the bonus history of the Rajratan Global?

06-Jun-2025

Rajratan Global Wire Ltd announced a 4:3 bonus issue on September 11, 2019, with a record date of September 12, 2019, meaning shareholders received four shares for every three shares held.

Rajratan Global Wire Ltd has a bonus history that includes a 4:3 bonus issue announced on September 11, 2019. The record date for this bonus was September 12, 2019. This means that for every three shares held, shareholders received four shares as part of this bonus issue. If you have any more questions about the company or its financials, feel free to ask!

View full answer

Has Rajratan Global declared dividend?

06-Jun-2025

Rajratan Global Wire Ltd has declared a 100% dividend, amounting to ₹2 per share, with an ex-date of July 23, 2024. While recent total returns show volatility with negative performance in shorter periods, the company has demonstrated strong growth over the longer term, particularly in the last 4 and 5 years.

Rajratan Global Wire Ltd has declared a 100% dividend.<BR><BR>Dividend Details:<BR>- Percentage announced: 100%<BR>- Amount per share: 2 per share<BR>- Ex-date: 23 Jul 24<BR><BR>Dividend Yield: 0.47%.<BR><BR>Total Returns by Period:<BR>In the last 6 months, the price return was -12.73%, with a dividend return of 0%, resulting in a total return of -12.73%.<BR><BR>Over the past year, the price return was -18.4%, while the dividend return was 0.36%, leading to a total return of -18.04%.<BR><BR>For the 2-year period, the price return was -42.66%, the dividend return was 0.49%, and the total return amounted to -42.17%.<BR><BR>In the 3-year timeframe, the price return was -39.03%, the dividend return was 0.69%, resulting in a total return of -38.34%.<BR><BR>Over the last 4 years, the price return was 100.68%, with a dividend return of 5.32%, culminating in a total return of 106.0%.<BR><BR>Finally, in the 5-year period, the price return was 888.67%, the dividend return was 31.61%, leading to an impressive total return of 920.28%.<BR><BR>Overall, while Rajratan Global has declared a dividend, the recent total returns indicate significant volatility, with negative returns in shorter periods but strong performance over the longer term, particularly in the 4 and 5-year spans.

View full answer
iScoreScore
Click here to find our call on this stock
Strong Sell
Sell
Hold
Buy
Strong Buy

Dashboard

1

High Management Efficiency with a high ROCE of 20.26%

 
2

Strong ability to service debt as the company has a low Debt to EBITDA ratio of 2.31 times

 
3

With a growth in Net Profit of 48.8%, the company declared Very Positive results in Jun 26

4

Majority shareholders : Promoters

 
stock-summaryMojo Parameters

Mojo Parameters

Loading Valuation Snapshot...

Stock DNA

stock-summary
Industry

Auto Components & Equipments

stock-summary
Market cap

INR 2,538 Cr (Small Cap)

stock-summary
P/E

31.00

stock-summary
Industry P/E

NA

stock-summary
Dividend Yield

0.41%

stock-summary
Debt Equity

0.44

stock-summary
Return on Equity

10.79%

stock-summary
Price to Book

3.83

Revenue and Profits:
Net Sales:
318 Cr
(Quarterly Results - Jun 2026)
Net Profit:
23 Cr
stock-summaryTotal Returns
Total Returns (Price + Dividend) stock-summary
Dividend Yield (0.41%)
TimePeriod
Price Return
Dividend Return
Total Return
3 Months
21.14%
0.46%
21.6%
6 Months
20.92%
0.52%
21.44%
1 Year
58.1%
0.61%
58.71%
2 Years
-15.2%
0.68%
-14.52%
3 Years
-32.86%
0.79%
-32.07%
4 Years
-54.62%
0.70%
-53.92%
5 Years
24.25%
2.47%
26.72%

Latest dividend: 2 per share ex-dividend date: Jul-17-2026

Risk Adjusted Returns v/s stock-summary
Returns Beta
Icon
Beta has not been calculated since enough price history is not available
stock-summaryNews & Corporate Actions

Announcements stock-summary

Icon
No announcement available

Corporate Actions stock-summary

stock-summary
BOARD MEETING

No Upcoming Board Meetings

stock-summary
DIVIDEND

Rajratan Global Wire Ltd has declared 100% dividend, ex-date: 17 Jul 26

stock-summary
SPLITS

Rajratan Global Wire Ltd has announced 2:10 stock split, ex-date: 15 Mar 22

stock-summary
BONUS

Rajratan Global Wire Ltd has announced 4:3 bonus issue, ex-date: 11 Sep 19

stock-summary
RIGHTS

No Rights history available

stock-summaryKey Factors

Quality key factors stock-summary

Factor
Value
Sales Growth (5y)
13.09%
EBIT Growth (5y)
2.82%
EBIT to Interest (avg)
6.29
Debt to EBITDA (avg)
1.67
Net Debt to Equity (avg)
0.44
Sales to Capital Employed (avg)
1.37
Tax Ratio
21.48%
Dividend Payout Ratio
14.48%
Pledged Shares
0
Institutional Holding
9.17%
ROCE (avg)
20.21%
ROE (avg)
19.03%

Valuation key factors

Factor
Value
P/E Ratio
31
Industry P/E
9
Price to Book Value
3.83
EV to EBIT
22.80
EV to EBITDA
18.43
EV to Capital Employed
2.96
EV to Sales
2.26
PEG Ratio
0.79
Dividend Yield
0.41%
ROCE (Latest)
11.92%
ROE (Latest)
10.79%

Technicals key factors

Indicator
Weekly
Monthly
MACD
Bullish
Mildly Bullish
RSI
No Signal
No Signal
Bollinger Bands
Mildly Bullish
Mildly Bullish
Moving Averages
Mildly Bullish (Daily)
KST
Bullish
Bullish
Dow Theory
No Trend
No Trend
OBV
Mildly Bearish
No Trend
stock-summary Technical Indicator Scale: Bearish, Mildly Bearish, Sideways, Mildly Bullish, Bullish  Turned 
stock-summaryShareholding
Shareholding Snapshot : Jun 2026stock-summary
Shareholding Compare (%holding) stock-summary
Majority shareholders

Promoters

Pledged Promoter Holdings

None

Mutual Funds

Held by 3 Schemes (7.72%)

FIIs

Held by 23 FIIs (0.83%)

Promoter with highest holding

Rajratan Investments Limited (18.5%)

Highest Public shareholder

Sbi Small Cap Fund (7.39%)

Individual Investors Holdings

22.1%

stock-summaryFinancial
[
  {
    "link": "quarterly",
    "btn_text": "All Quarterly Results",
    "header": "Quarterly Results Snapshot (Consolidated) - Jun'26 - QoQ",
    "rhs": [
      {
        "prefix": "Net Sales ",
        "suffix": "QoQ Growth in quarter ended Jun 2026 is 1.29% vs 4.23% in Mar 2026",
        "dir": -1
      },
      {
        "prefix": "Consolidated Net Profit ",
        "suffix": "QoQ Growth in quarter ended Jun 2026 is 48.80% vs -25.42% in Mar 2026",
        "dir": 1
      }
    ],
    "table": {
      "header": [
        "Jun'26",
        "Mar'26",
        "Change(%)"
      ],
      "body": [
        {
          "field": "Net Sales",
          "val1": "318.35",
          "val2": "314.29",
          "chgp": "1.29%",
          "chgp_class": "positive"
        },
        {
          "field": "Operating Profit (PBDIT) excl Other Income",
          "val1": "41.71",
          "val2": "28.60",
          "chgp": "45.84%",
          "chgp_class": "positive"
        },
        {
          "field": "Interest",
          "val1": "7.45",
          "val2": "6.13",
          "chgp": "21.53%",
          "chgp_class": "negative"
        },
        {
          "field": "Exceptional Items",
          "val1": "0.00",
          "val2": "0.00",
          "chgp": "",
          "chgp_class": "neutral"
        },
        {
          "field": "Consolidate Net Profit",
          "val1": "22.96",
          "val2": "15.43",
          "chgp": "48.80%",
          "chgp_class": "positive"
        },
        {
          "field": "Operating Profit Margin (Excl OI)",
          "val1": "13.10%",
          "val2": "9.10%",
          "chgp": "4.00%",
          "chgp_class": "positive"
        }
      ]
    }
  },
  {
    "link": "half-yearly",
    "btn_text": "All Half Yearly Results",
    "header": "Half Yearly Results Snapshot (Consolidated) - Sep'25",
    "rhs": [
      {
        "prefix": "Net Sales ",
        "suffix": " Growth in half year ended Sep 2025 is 16.16% vs 11.31% in Sep 2024",
        "dir": 1
      },
      {
        "prefix": "Consolidated Net Profit ",
        "suffix": " Growth in half year ended Sep 2025 is -0.64% vs 7.46% in Sep 2024",
        "dir": -1
      }
    ],
    "table": {
      "header": [
        "Sep'25",
        "Sep'24",
        "Change(%)"
      ],
      "body": [
        {
          "field": "Net Sales",
          "val1": "540.68",
          "val2": "465.47",
          "chgp": "16.16%",
          "chgp_class": "positive"
        },
        {
          "field": "Operating Profit (PBDIT) excl Other Income",
          "val1": "70.96",
          "val2": "67.39",
          "chgp": "5.30%",
          "chgp_class": "positive"
        },
        {
          "field": "Interest",
          "val1": "15.07",
          "val2": "12.82",
          "chgp": "17.55%",
          "chgp_class": "negative"
        },
        {
          "field": "Exceptional Items",
          "val1": "0.00",
          "val2": "0.00",
          "chgp": "",
          "chgp_class": "neutral"
        },
        {
          "field": "Consolidate Net Profit",
          "val1": "34.07",
          "val2": "34.29",
          "chgp": "-0.64%",
          "chgp_class": "negative"
        },
        {
          "field": "Operating Profit Margin (Excl OI)",
          "val1": "13.12%",
          "val2": "14.48%",
          "chgp": "-1.36%",
          "chgp_class": "negative"
        }
      ]
    }
  },
  {
    "link": "nine-monthly",
    "btn_text": "All Nine Monthly Results",
    "header": "Nine Monthly Results Snapshot (Consolidated) - Dec'25",
    "rhs": [
      {
        "prefix": "Net Sales ",
        "suffix": "YoY Growth in nine months ended Dec 2025 is 23.16% vs 5.06% in Dec 2024",
        "dir": 1
      },
      {
        "prefix": "Consolidated Net Profit ",
        "suffix": "YoY Growth in nine months ended Dec 2025 is 25.60% vs -15.49% in Dec 2024",
        "dir": 1
      }
    ],
    "table": {
      "header": [
        "Dec'25",
        "Dec'24",
        "Change(%)"
      ],
      "body": [
        {
          "field": "Net Sales",
          "val1": "842.21",
          "val2": "683.83",
          "chgp": "23.16%",
          "chgp_class": "positive"
        },
        {
          "field": "Operating Profit (PBDIT) excl Other Income",
          "val1": "111.35",
          "val2": "93.63",
          "chgp": "18.93%",
          "chgp_class": "positive"
        },
        {
          "field": "Interest",
          "val1": "22.30",
          "val2": "20.69",
          "chgp": "7.78%",
          "chgp_class": "negative"
        },
        {
          "field": "Exceptional Items",
          "val1": "0.00",
          "val2": "0.00",
          "chgp": "",
          "chgp_class": "neutral"
        },
        {
          "field": "Consolidate Net Profit",
          "val1": "54.76",
          "val2": "43.60",
          "chgp": "25.60%",
          "chgp_class": "positive"
        },
        {
          "field": "Operating Profit Margin (Excl OI)",
          "val1": "13.22%",
          "val2": "13.69%",
          "chgp": "-0.47%",
          "chgp_class": "negative"
        }
      ]
    }
  },
  {
    "link": "annual",
    "btn_text": "All Annual Results",
    "header": "Annual Results Snapshot (Consolidated) - Mar'26",
    "rhs": [
      {
        "prefix": "Net Sales ",
        "suffix": "YoY Growth in year ended Mar 2026 is 23.66% vs 5.03% in Mar 2025",
        "dir": 1
      },
      {
        "prefix": "Consolidated Net Profit ",
        "suffix": "YoY Growth in year ended Mar 2026 is 19.23% vs -18.15% in Mar 2025",
        "dir": 1
      }
    ],
    "table": {
      "header": [
        "Mar'26",
        "Mar'25",
        "Change(%)"
      ],
      "body": [
        {
          "field": "Net Sales",
          "val1": "1,156.50",
          "val2": "935.25",
          "chgp": "23.66%",
          "chgp_class": "positive"
        },
        {
          "field": "Operating Profit (PBDIT) excl Other Income",
          "val1": "139.95",
          "val2": "126.96",
          "chgp": "10.23%",
          "chgp_class": "positive"
        },
        {
          "field": "Interest",
          "val1": "28.43",
          "val2": "28.17",
          "chgp": "0.92%",
          "chgp_class": "negative"
        },
        {
          "field": "Exceptional Items",
          "val1": "0.00",
          "val2": "0.00",
          "chgp": "",
          "chgp_class": "neutral"
        },
        {
          "field": "Consolidate Net Profit",
          "val1": "70.11",
          "val2": "58.80",
          "chgp": "19.23%",
          "chgp_class": "positive"
        },
        {
          "field": "Operating Profit Margin (Excl OI)",
          "val1": "12.10%",
          "val2": "13.57%",
          "chgp": "-1.47%",
          "chgp_class": "negative"
        }
      ]
    }
  }
]

Quarterly Results Snapshot (Consolidated) - Jun'26 - QoQstock-summary

Jun'26
Mar'26
Change(%)
Net Sales
318.35
314.29
1.29%
Operating Profit (PBDIT) excl Other Income
41.71
28.60
45.84%
Interest
7.45
6.13
21.53%
Exceptional Items
0.00
0.00
Consolidate Net Profit
22.96
15.43
48.80%
Operating Profit Margin (Excl OI)
13.10%
9.10%
4.00%
Values in Rs Cr.
Direction Arrows
Net Sales

QoQ Growth in quarter ended Jun 2026 is 1.29% vs 4.23% in Mar 2026

Direction Arrows
Consolidated Net Profit

QoQ Growth in quarter ended Jun 2026 is 48.80% vs -25.42% in Mar 2026

Half Yearly Results Snapshot (Consolidated) - Sep'25stock-summary

Sep'25
Sep'24
Change(%)
Net Sales
540.68
465.47
16.16%
Operating Profit (PBDIT) excl Other Income
70.96
67.39
5.30%
Interest
15.07
12.82
17.55%
Exceptional Items
0.00
0.00
Consolidate Net Profit
34.07
34.29
-0.64%
Operating Profit Margin (Excl OI)
13.12%
14.48%
-1.36%
Values in Rs Cr.
Direction Arrows
Net Sales

Growth in half year ended Sep 2025 is 16.16% vs 11.31% in Sep 2024

Direction Arrows
Consolidated Net Profit

Growth in half year ended Sep 2025 is -0.64% vs 7.46% in Sep 2024

Nine Monthly Results Snapshot (Consolidated) - Dec'25stock-summary

Dec'25
Dec'24
Change(%)
Net Sales
842.21
683.83
23.16%
Operating Profit (PBDIT) excl Other Income
111.35
93.63
18.93%
Interest
22.30
20.69
7.78%
Exceptional Items
0.00
0.00
Consolidate Net Profit
54.76
43.60
25.60%
Operating Profit Margin (Excl OI)
13.22%
13.69%
-0.47%
Values in Rs Cr.
Direction Arrows
Net Sales

YoY Growth in nine months ended Dec 2025 is 23.16% vs 5.06% in Dec 2024

Direction Arrows
Consolidated Net Profit

YoY Growth in nine months ended Dec 2025 is 25.60% vs -15.49% in Dec 2024

Annual Results Snapshot (Consolidated) - Mar'26stock-summary

Mar'26
Mar'25
Change(%)
Net Sales
1,156.50
935.25
23.66%
Operating Profit (PBDIT) excl Other Income
139.95
126.96
10.23%
Interest
28.43
28.17
0.92%
Exceptional Items
0.00
0.00
Consolidate Net Profit
70.11
58.80
19.23%
Operating Profit Margin (Excl OI)
12.10%
13.57%
-1.47%
Values in Rs Cr.
Direction Arrows
Net Sales

YoY Growth in year ended Mar 2026 is 23.66% vs 5.03% in Mar 2025

Direction Arrows
Consolidated Net Profit

YoY Growth in year ended Mar 2026 is 19.23% vs -18.15% in Mar 2025

stock-summaryCompany CV
About Rajratan Global Wire Ltd stock-summary
stock-summary
Rajratan Global Wire Ltd
Small Cap
Auto Components & Equipments
Rajratan Global Wire Company Limited along with its wholly owned subsidiary, M/s. Rajratan Thai Wire Company Limited is engaged in the business of manufacturing and sale of tyre bead wire. In addition, the Company has a wind mill located in India for generation of electricity. The Company has a modern factory at Pithampur, 25 Km from Indore, a prominent industrial city in Central India. With "state of the art" plant, it produces high value steel wires with precise product characteristics.
Company Coordinates stock-summary
Company Details
Rajratan House, 11/2 Meera Path Dhenu Market Indore Madhya Pradesh : 452003
stock-summary
Tel: 91-0731-2546401
stock-summary
investor-cell@rgwl.co.in
Registrar Details
Link Intime India Pvt Ltd, C-13 Pannalal Silk Compound, L B S Marg, Bhandup , Mumbai