Automotive Axles

  • Market Cap: Small Cap
  • Industry: Auto Components & Equipments
  • ISIN: INE449A01011
  • NSEID: AUTOAXLES
  • BSEID: 505010
INR
1,730.00
1.4 (0.08%)
BSENSE

Sep 01, 10:33 AM

BSE+NSE Vol: 1.2 k

  • Price Points
  • Score
  • Mojo Parameters
  • Total Return
  • News and Corporate Actions
  • Key factors
  • Shareholding
  • Financials
  • CompanyCV
stock-summaryPrice Point
High/Low

1Day

52 Week

Valuation
Technical
Day's Volume

CASH

1.2 k (-15.21%) Volume

Shareholding (Jun 2026)

FII

0.75%

Held by 40 FIIs

DII

15.44%

Held by 16 DIIs

Promoter

71.04%

Why is Automotive Axles Ltd falling/rising?

01-Sep-2026

As of 31-Aug, Automotive Axles Ltd's stock price is 1,730.00, down 0.29%, and has underperformed against the Sensex over various time frames. Despite strong management efficiency and being net-debt free, the stock's decline is attributed to reduced investor interest and lower trading volumes.

As of 31-Aug, Automotive Axles Ltd's stock price is falling, currently at 1,730.00, reflecting a change of -5.0 (-0.29%). The stock has underperformed against the benchmark Sensex, with a performance of -1.06% over the past week compared to the Sensex's -0.53%. Over the past month, the stock has decreased by 4.02%, while the Sensex has only fallen by 1.46%. Year-to-date, the stock is down 7.56%, which is less severe than the Sensex's decline of 9.70%.<BR><BR>Today's performance indicates that the stock is trading lower than its moving averages across various periods, including the 5-day, 20-day, 50-day, 100-day, and 200-day averages. Additionally, there has been a significant drop in investor participation, with delivery volume on 28 August falling by 66.76% against the 5-day average. This decline in trading activity suggests a lack of interest from investors, contributing to the stock's downward movement.<BR><BR>Despite these negative indicators, the company maintains a high management efficiency with a return on equity (ROE) of 16.78% and is net-debt free, which are positive factors. However, these strengths have not been enough to counteract the recent price decline, as the stock's performance has been overshadowed by its recent underperformance and reduced trading activity.

View full answer

Who are in the management team of Automotive Axles?

01-Sep-2026

The management team of Automotive Axles includes Baba Kalyani (Chairman), Kenneth James Hogan, B B Hattarki, B C Prabhakar, Shalini Sarin (all Non-Executive Directors), and Nagaraja Sadashiva Murthy Gargeshwari (Whole-time Director).

The management team of Automotive Axles includes the following individuals:<BR><BR>1. **Baba Kalyani** - Chairman & Non-Executive Director<BR>2. **Kenneth James Hogan** - Non-Executive Director<BR>3. **B B Hattarki** - Independent Non-Executive Director<BR>4. **B C Prabhakar** - Independent Non-Executive Director<BR>5. **Shalini Sarin** - Independent Non-Executive Director<BR>6. **Nagaraja Sadashiva Murthy Gargeshwari** - Whole-time Director<BR><BR>If you need more details about their roles or the company, feel free to ask!

View full answer

What does Automotive Axles do?

01-Sep-2026

Automotive Axles Ltd is India's largest independent manufacturer of Rear Drive Axle Assemblies, established in 1981 as a joint venture. As of June 2026, it reported net sales of ₹517 Cr and a net profit of ₹46 Cr, with a market cap of ₹2,625 Cr.

Overview:<BR>Automotive Axles Ltd is the largest independent manufacturer of Rear Drive Axle Assemblies in India, operating within the Auto Components & Equipments industry and classified as a Small Cap company.<BR><BR>History:<BR>The company was incorporated in 1981 as a joint venture between Bharat Forge Limited, Pune, India, and Meritor Heavy Vehicle Systems LLC, USA. The latest quarterly results reported net sales and profit for June 2026.<BR><BR>Financial Snapshot:<BR>- Net Sales: 517 Cr (Quarterly Results - Jun 2026)<BR>- Net Profit: 46 Cr (Quarterly Results - Jun 2026)<BR>- Market Cap: INR 2,625 Cr (Small Cap)<BR><BR>Key Metrics:<BR>- P/E: 14.00<BR>- Industry P/E: 41<BR>- Dividend Yield: 1.84%<BR>- Debt Equity: -0.35<BR>- Return on Equity: 16.69%<BR>- Price to Book: 2.40<BR><BR>Contact Details:<BR>Address: Hootagalli Industrial Area, Off Hunsur Road Mysore Karnataka : 570018<BR>Tel: 91-0821-7197500<BR>Email: sec@autoaxle.com<BR>Website: http://www.autoaxle.com

View full answer

Who are the peers of the Automotive Axles?

01-Sep-2026

Peers of Automotive Axles include Federal-Mogul Go, Carraro India, Rane (Madras), MM Forgings, Sundaram Clayton, Rajratan Global, Talbros Auto, India Nipp.Elec., and GNA Axles. Automotive Axles has good management risk and capital structure, with a 1-year return of -0.40%, outperforming only Sundaram Clayton.

Peers: The peers of Automotive Axles are Federal-Mogul Go, Carraro India, Rane (Madras), MM Forgings, Sundaram Clayton, Rajratan Global, Talbros Auto., India Nipp.Elec., and GNA Axles.<BR><BR>Quality Snapshot: Excellent management risk is observed at Carraro India, Rajratan Global, and GNA Axles, while Good management risk is found at Automotive Axles and the rest. Average management risk is seen at Federal-Mogul Go, Rane (Madras), MM Forgings, and Talbros Auto., while Below Average management risk is noted at Sundaram Clayton and Sar Auto Prod. Growth is Excellent at Rane (Madras), Good at Carraro India, and Average at Automotive Axles, while Below Average growth is found at Federal-Mogul Go, MM Forgings, Sundaram Clayton, Rajratan Global, Talbros Auto., India Nipp.Elec., and GNA Axles. Capital Structure is Excellent at Federal-Mogul Go, Automotive Axles, India Nipp.Elec., and GNA Axles, Good at Carraro India, Rajratan Global, and Talbros Auto., while Average is noted at MM Forgings and Below Average at Rane (Madras) and Sundaram Clayton.<BR><BR>Return Snapshot: The peer with the highest 1-year return is MM Forgings at 105.71%, while the lowest is Sundaram Clayton at -21.39%. Automotive Axles has a 1-year return of -0.40%, which is higher than Sundaram Clayton but lower than the majority of its peers. Additionally, Sundaram Clayton is the only peer with a negative six-month return.

View full answer

How big is Automotive Axles?

01-Sep-2026

As of 31st August, Automotive Axles Ltd has a market capitalization of 2,625.00 Cr, with recent net sales of 2,205.17 Cr and a net profit of 174.25 Cr.

As of 31st August, Automotive Axles Ltd has a market capitalization of 2,625.00 Cr, classifying it as a Small Cap company.<BR><BR>In the latest four quarters, Automotive Axles reported Net Sales of 2,205.17 Cr and a Net Profit of 174.25 Cr.<BR><BR>The latest annual period for the balance sheet is March 2026, with Shareholder's Funds amounting to 1,098.77 Cr and Total Assets of 1,515.61 Cr.

View full answer

Should I buy, sell or hold Automotive Axles Ltd?

06-Aug-2026

When is the next results date for Automotive Axles Ltd?

28-Jul-2026

The next results date for Automotive Axles Ltd is 05 August 2026.

The next results date for Automotive Axles Ltd is scheduled for 05 August 2026.

View full answer

Are Automotive Axles Ltd latest results good or bad?

20-May-2026

Automotive Axles Ltd's latest Q4 FY26 results are positive, with a net profit of ₹53.89 crore, up 38.85% quarter-on-quarter and 17.33% year-on-year, alongside an 18.14% revenue increase. However, the full fiscal year FY25 saw declines in both revenue and profit, indicating cyclical challenges in the sector.

Automotive Axles Ltd's latest results for Q4 FY26 are quite positive. The company reported a net profit of ₹53.89 crore, which reflects a significant increase of 38.85% quarter-on-quarter and 17.33% year-on-year. Additionally, revenue for the same quarter reached ₹664.30 crore, marking an 18.14% increase from the previous quarter and an 18.70% rise compared to the same quarter last year.<BR><BR>The operating margin also showed improvement, reaching 11.59%, which is the highest in five quarters. This indicates better operational efficiency as the company managed to absorb higher volumes without a proportional increase in fixed costs.<BR><BR>However, it's important to note that while the quarterly performance is strong, the full fiscal year FY25 presented challenges, with a revenue decline of 6.80% and a net profit decrease of 6.63%. This divergence highlights the cyclical nature of the commercial vehicle component sector, which can lead to fluctuations in performance.<BR><BR>Overall, the latest quarterly results are a positive sign, suggesting a recovery and potential for growth moving forward, despite the mixed performance over the entire fiscal year.

View full answer

Is Automotive Axles technically bullish or bearish?

03-Dec-2025

As of December 2, 2025, Automotive Axles shows a mildly bullish trend supported by positive weekly and monthly indicators, although daily moving averages suggest some caution.

As of 2 December 2025, the technical trend for Automotive Axles has changed from sideways to mildly bullish. The weekly and monthly MACD, KST, and Dow Theory indicators are all mildly bullish, supporting a positive outlook. Bollinger Bands also indicate a bullish stance on both weekly and monthly time frames. However, the daily moving averages are mildly bearish, which introduces some caution. Overall, the current technical stance is mildly bullish, driven primarily by the strength in the MACD, KST, and Dow Theory indicators.

View full answer

How has been the historical performance of Automotive Axles?

28-Nov-2025

Automotive Axles has experienced fluctuating net sales and profitability, with a decline in net sales from 2,323.70 Cr in March 2023 to 2,077.54 Cr in March 2025, despite a significant increase from 1,490.62 Cr in March 2022. The company faces challenges in maintaining profitability and cash flow stability, with operating profit and cash flow from operations both decreasing in recent years.

Answer:<BR>The historical performance of Automotive Axles shows a fluctuating trend in net sales and profitability over the years. <BR><BR>Breakdown:<BR>Automotive Axles reported net sales of 2,077.54 Cr in March 2025, a decline from 2,229.17 Cr in March 2024 and 2,323.70 Cr in March 2023, but a significant increase from 1,490.62 Cr in March 2022. The total operating income followed a similar pattern, peaking at 2,323.70 Cr in March 2023 before decreasing in subsequent years. The raw material cost has also seen a decrease, from 1,675.15 Cr in March 2023 to 1,474.95 Cr in March 2025. Operating profit (PBDIT) was 247.23 Cr in March 2025, down from 262.00 Cr in March 2024, while profit before tax was 210.61 Cr, slightly lower than the previous year's 222.97 Cr. Profit after tax showed a similar trend, with 155.54 Cr in March 2025 compared to 166.16 Cr in March 2024. The company's total assets increased to 1,354.71 Cr in March 2025 from 1,226.38 Cr in March 2024, while total liabilities also rose to 1,354.71 Cr from 1,226.38 Cr. Cash flow from operating activities decreased significantly to 128.00 Cr in March 2025 from 260.00 Cr in March 2024, resulting in a net cash outflow of 24.00 Cr in March 2025. Overall, while Automotive Axles has seen growth in certain areas, it faces challenges in maintaining profitability and cash flow stability.

View full answer

Is Automotive Axles overvalued or undervalued?

09-Jun-2025

As of May 21, 2025, Automotive Axles is considered undervalued with an attractive valuation grade, a PE ratio of 17.50, an EV to EBITDA of 12.17, a ROCE of 22.01%, and a dividend yield of 1.78%, despite underperforming the Sensex over the past year.

As of 21 May 2025, the valuation grade for Automotive Axles has moved from fair to attractive, indicating a positive shift in its market perception. The company is currently considered undervalued. Key ratios include a PE Ratio of 17.50, an EV to EBITDA of 12.17, and a ROCE of 22.01%. <BR><BR>In comparison to its peers, Automotive Axles has a more favorable valuation than Samvardhan Motherson, which has a PE of 29.14, and Bosch, which is considered expensive with a PE of 46.21. The company's dividend yield stands at 1.78%, further enhancing its attractiveness to investors. While Automotive Axles has underperformed the Sensex over the past year with a return of -9.00% compared to the Sensex's 7.65%, its strong fundamentals suggest it may be poised for recovery.

View full answer

Who are the top shareholders of the Automotive Axles?

06-Jun-2025

The top shareholders of Automotive Axles include Bf Investment Limited with 35.52%, mutual funds with 13.4%, and Nippon Life India Trustee Ltd with 8.81%. Individual investors hold 12.86%, while Foreign Institutional Investors have 0.54%, with no pledged promoter holdings reported.

The top shareholders of Automotive Axles include several key players. The majority shareholder is Bf Investment Limited, which holds a significant 35.52% of the shares. Additionally, mutual funds collectively hold 13.4% through 10 different schemes. The highest public shareholder is Nippon Life India Trustee Ltd, representing various schemes, with an 8.81% stake. Individual investors also have a notable presence, holding 12.86% of the shares. Foreign Institutional Investors (FIIs) hold a smaller portion, with 0.54% across 33 different entities. There are no pledged promoter holdings reported.

View full answer

Has Automotive Axles declared dividend?

06-Jun-2025

Yes, Automotive Axles Ltd has declared a dividend of 320% (₹32 per share), with an ex-date of July 29, 2024. While recent short-term returns have been negative, the company has shown significant long-term growth over the past five years.

Automotive Axles Ltd has declared a dividend of 320%.<BR><BR>Dividend Details:<BR>- Percentage announced: 320%<BR>- Amount per share: 32<BR>- Ex-date: 29 Jul 24<BR><BR>Dividend Yield: 1.77%.<BR><BR>Total Returns by Period:<BR>In the last 6 months, the price return was -1.91%, with a dividend return of 0%, resulting in a total return of -1.91%.<BR><BR>Over the past year, the price return was -9.65%, the dividend return was 1.63%, leading to a total return of -8.02%.<BR><BR>In the 2-year period, the price return was -18.18%, the dividend return was 2.82%, culminating in a total return of -15.36%.<BR><BR>For the 3-year period, the price return was 6.8%, the dividend return was 5.10%, which resulted in a total return of 11.9%.<BR><BR>In the last 4 years, the price return was 34.47%, the dividend return was 6.31%, leading to a total return of 40.78%.<BR><BR>Finally, over the past 5 years, the price return was 248.8%, with a dividend return of 14.54%, resulting in a total return of 263.34%.<BR><BR>Overall, Automotive Axles Ltd has declared a substantial dividend, and while the short-term returns have been negative, the long-term performance, particularly over 5 years, shows significant growth, indicating a potential for recovery and value for shareholders.

View full answer
iScoreScore
Click here to find our call on this stock
Strong Sell
Sell
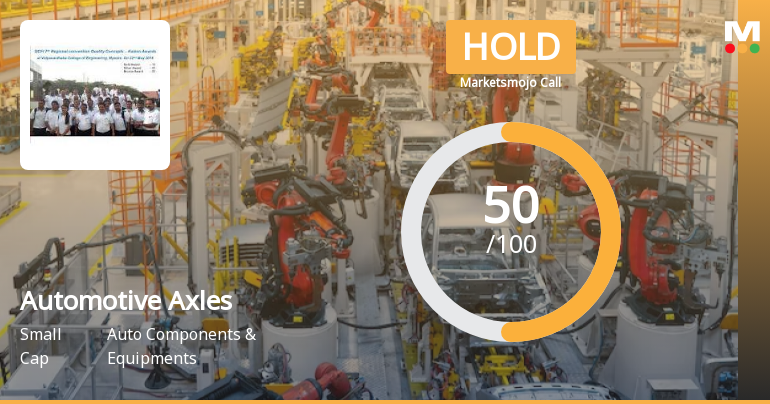
Hold
Buy
Strong Buy

Dashboard

1

High Management Efficiency with a high ROE of 16.78%

 
2

The company is Net-Debt Free

 
3

Flat results in Jun 26

4

With ROE of 16.7, it has a Attractive valuation with a 2.4 Price to Book Value

5

Majority shareholders : Promoters

 
6

Consistent Underperformance against the benchmark over the last 3 years

stock-summaryMojo Parameters

Mojo Parameters

Loading Valuation Snapshot...

Stock DNA

stock-summary
Industry

Auto Components & Equipments

stock-summary
Market cap

INR 2,614 Cr (Small Cap)

stock-summary
P/E

14.00

stock-summary
Industry P/E

41

stock-summary
Dividend Yield

1.85%

stock-summary
Debt Equity

-0.35

stock-summary
Return on Equity

16.69%

stock-summary
Price to Book

2.38

Revenue and Profits:
Net Sales:
517 Cr
(Quarterly Results - Jun 2026)
Net Profit:
46 Cr
stock-summaryTotal Returns
Total Returns (Price + Dividend) stock-summary
Dividend Yield (1.85%)
TimePeriod
Price Return
Dividend Return
Total Return
3 Months
0.02%
1.86%
1.88%
6 Months
-15.43%
1.59%
-13.84%
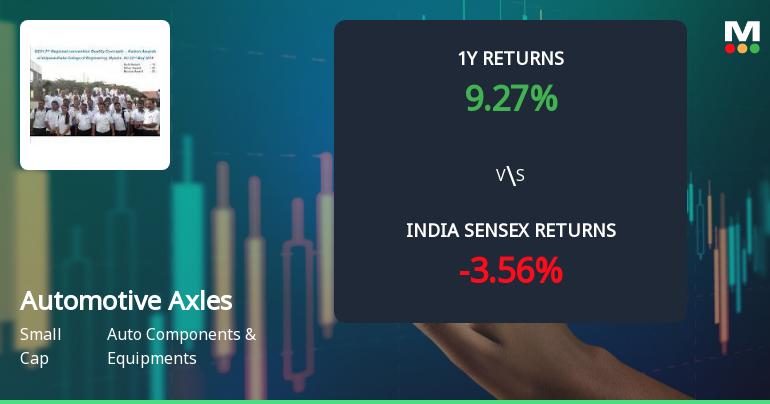
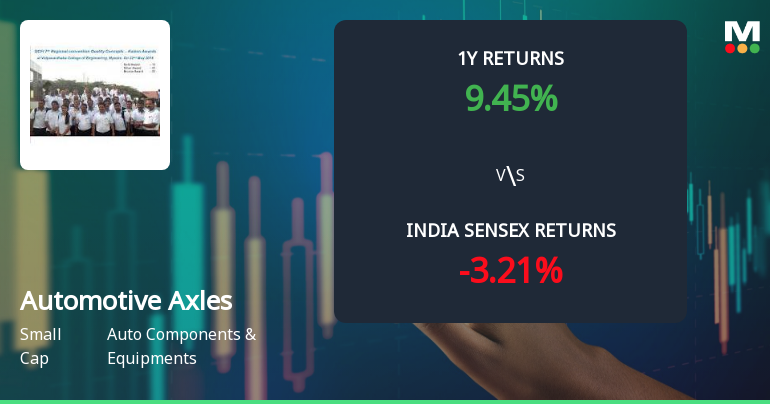
1 Year
-2.51%
1.88%
-0.63%
2 Years
-15.06%
3.15%
-11.91%
3 Years
-22.49%
4.18%
-18.31%
4 Years
-10.27%
6.35%
-3.92%
5 Years
37.64%
11.15%
48.79%

Latest dividend: 31.950401694608768 per share ex-dividend date: Aug-05-2026

Risk Adjusted Returns v/s stock-summary
Returns Beta
Icon
Beta has not been calculated since enough price history is not available
stock-summaryNews & Corporate Actions

Announcements stock-summary

Automotive Axles Limited - Investor Presentation

22-Nov-2019 | Source : NSE

Automotive Axles Limited has informed the Exchange regarding Investor Presentation 22nd Nov. 2019

Automotive Axles Limited - Analysts/Institutional Investor Meet/Con. Call Updates

21-Nov-2019 | Source : NSE

Automotive Axles Limited has informed the Exchange regarding Analysts/Institutional Investor Meet/Con. Call Updates on 22nd November, 2019

Automotive Axles Limited - Credit Rating

14-Nov-2019 | Source : NSE

Automotive Axles Limited has informed the Exchange regarding Credit Rating

Corporate Actions stock-summary

stock-summary
BOARD MEETING

No Upcoming Board Meetings

stock-summary
DIVIDEND

Automotive Axles Ltd has declared 320% dividend, ex-date: 05 Aug 26

stock-summary
SPLITS

No Splits history available

stock-summary
BONUS

No Bonus history available

stock-summary
RIGHTS

No Rights history available

stock-summaryKey Factors

Quality key factors stock-summary

Factor
Value
Sales Growth (5y)
14.47%
EBIT Growth (5y)
29.02%
EBIT to Interest (avg)
81.70
Debt to EBITDA (avg)
0.15
Net Debt to Equity (avg)
-0.35
Sales to Capital Employed (avg)
2.28
Tax Ratio
25.20%
Dividend Payout Ratio
29.63%
Pledged Shares
0
Institutional Holding
16.19%
ROCE (avg)
22.10%
ROE (avg)
16.78%

Valuation key factors

Factor
Value
P/E Ratio
14
Industry P/E
41
Price to Book Value
2.38
EV to EBIT
10.46
EV to EBITDA
8.95
EV to Capital Employed
3.12
EV to Sales
1.01
PEG Ratio
0.86
Dividend Yield
1.85%
ROCE (Latest)
28.19%
ROE (Latest)
16.69%

Technicals key factors

Indicator
Weekly
Monthly
MACD
Bearish
Bearish
RSI
No Signal
No Signal
Bollinger Bands
Bearish
Bearish
Moving Averages
Bearish (Daily)
KST
Bullish
Bullish
Dow Theory
No Trend
Mildly Bullish
OBV
No Trend
Bullish
stock-summary Technical Indicator Scale: Bearish, Mildly Bearish, Sideways, Mildly Bullish, Bullish  Turned 
stock-summaryShareholding
Shareholding Snapshot : Jun 2026stock-summary
Shareholding Compare (%holding) stock-summary
Majority shareholders

Promoters

Pledged Promoter Holdings

None

Mutual Funds

Held by 8 Schemes (15.31%)

FIIs

Held by 40 FIIs (0.75%)

Promoter with highest holding

Bf Investment Limited (35.52%)

Highest Public shareholder

Nippon Life India Trustee Ltd (8.81%)

Individual Investors Holdings

10.47%

stock-summaryFinancial
[
  {
    "link": "quarterly",
    "btn_text": "All Quarterly Results",
    "header": "Quarterly Results Snapshot (Standalone) - Jun'26 - YoY",
    "rhs": [
      {
        "prefix": "Net Sales ",
        "suffix": "YoY Growth in quarter ended Jun 2026 is 5.61% vs -0.63% in Jun 2025",
        "dir": 1
      },
      {
        "prefix": "Standalone Net Profit ",
        "suffix": "YoY Growth in quarter ended Jun 2026 is 27.66% vs 4.90% in Jun 2025",
        "dir": 1
      }
    ],
    "table": {
      "header": [
        "Jun'26",
        "Jun'25",
        "Change(%)"
      ],
      "body": [
        {
          "field": "Net Sales",
          "val1": "516.82",
          "val2": "489.38",
          "chgp": "5.61%",
          "chgp_class": "positive"
        },
        {
          "field": "Operating Profit (PBDIT) excl Other Income",
          "val1": "59.90",
          "val2": "47.88",
          "chgp": "25.10%",
          "chgp_class": "positive"
        },
        {
          "field": "Interest",
          "val1": "0.42",
          "val2": "0.39",
          "chgp": "7.69%",
          "chgp_class": "negative"
        },
        {
          "field": "Exceptional Items",
          "val1": "0.00",
          "val2": "0.00",
          "chgp": "",
          "chgp_class": "neutral"
        },
        {
          "field": "Standalone Net Profit",
          "val1": "45.60",
          "val2": "35.72",
          "chgp": "27.66%",
          "chgp_class": "positive"
        },
        {
          "field": "Operating Profit Margin (Excl OI)",
          "val1": "11.59%",
          "val2": "9.78%",
          "chgp": "1.81%",
          "chgp_class": "positive"
        }
      ]
    }
  },
  {
    "link": "half-yearly",
    "btn_text": "All Half Yearly Results",
    "header": "Half Yearly Results Snapshot (Standalone) - Sep'25",
    "rhs": [
      {
        "prefix": "Net Sales ",
        "suffix": " Growth in half year ended Sep 2025 is -3.65% vs -11.57% in Sep 2024",
        "dir": 1
      },
      {
        "prefix": "Standalone Net Profit ",
        "suffix": " Growth in half year ended Sep 2025 is 2.36% vs -15.53% in Sep 2024",
        "dir": 1
      }
    ],
    "table": {
      "header": [
        "Sep'25",
        "Sep'24",
        "Change(%)"
      ],
      "body": [
        {
          "field": "Net Sales",
          "val1": "951.14",
          "val2": "987.15",
          "chgp": "-3.65%",
          "chgp_class": "negative"
        },
        {
          "field": "Operating Profit (PBDIT) excl Other Income",
          "val1": "96.16",
          "val2": "99.92",
          "chgp": "-3.76%",
          "chgp_class": "negative"
        },
        {
          "field": "Interest",
          "val1": "0.74",
          "val2": "1.66",
          "chgp": "-55.42%",
          "chgp_class": "positive"
        },
        {
          "field": "Exceptional Items",
          "val1": "0.00",
          "val2": "0.00",
          "chgp": "",
          "chgp_class": "neutral"
        },
        {
          "field": "Standalone Net Profit",
          "val1": "71.68",
          "val2": "70.03",
          "chgp": "2.36%",
          "chgp_class": "positive"
        },
        {
          "field": "Operating Profit Margin (Excl OI)",
          "val1": "10.11%",
          "val2": "10.12%",
          "chgp": "-0.01%",
          "chgp_class": "negative"
        }
      ]
    }
  },
  {
    "link": "nine-monthly",
    "btn_text": "All Nine Monthly Results",
    "header": "Nine Monthly Results Snapshot (Standalone) - Dec'25",
    "rhs": [
      {
        "prefix": "Net Sales ",
        "suffix": "YoY Growth in nine months ended Dec 2025 is -0.29% vs -8.43% in Dec 2024",
        "dir": 1
      },
      {
        "prefix": "Standalone Net Profit ",
        "suffix": "YoY Growth in nine months ended Dec 2025 is 0.80% vs -10.20% in Dec 2024",
        "dir": 1
      }
    ],
    "table": {
      "header": [
        "Dec'25",
        "Dec'24",
        "Change(%)"
      ],
      "body": [
        {
          "field": "Net Sales",
          "val1": "1,513.43",
          "val2": "1,517.89",
          "chgp": "-0.29%",
          "chgp_class": "negative"
        },
        {
          "field": "Operating Profit (PBDIT) excl Other Income",
          "val1": "160.04",
          "val2": "157.39",
          "chgp": "1.68%",
          "chgp_class": "positive"
        },
        {
          "field": "Interest",
          "val1": "1.15",
          "val2": "2.34",
          "chgp": "-50.85%",
          "chgp_class": "positive"
        },
        {
          "field": "Exceptional Items",
          "val1": "-11.99",
          "val2": "0.00",
          "chgp": "",
          "chgp_class": "neutral"
        },
        {
          "field": "Standalone Net Profit",
          "val1": "110.49",
          "val2": "109.61",
          "chgp": "0.80%",
          "chgp_class": "positive"
        },
        {
          "field": "Operating Profit Margin (Excl OI)",
          "val1": "10.57%",
          "val2": "10.37%",
          "chgp": "0.20%",
          "chgp_class": "positive"
        }
      ]
    }
  },
  {
    "link": "annual",
    "btn_text": "All Annual Results",
    "header": "Annual Results Snapshot (Standalone) - Mar'26",
    "rhs": [
      {
        "prefix": "Net Sales ",
        "suffix": "YoY Growth in year ended Mar 2026 is 4.82% vs -6.80% in Mar 2025",
        "dir": 1
      },
      {
        "prefix": "Standalone Net Profit ",
        "suffix": "YoY Growth in year ended Mar 2026 is 5.68% vs -6.39% in Mar 2025",
        "dir": 1
      }
    ],
    "table": {
      "header": [
        "Mar'26",
        "Mar'25",
        "Change(%)"
      ],
      "body": [
        {
          "field": "Net Sales",
          "val1": "2,177.73",
          "val2": "2,077.54",
          "chgp": "4.82%",
          "chgp_class": "positive"
        },
        {
          "field": "Operating Profit (PBDIT) excl Other Income",
          "val1": "237.06",
          "val2": "220.02",
          "chgp": "7.74%",
          "chgp_class": "positive"
        },
        {
          "field": "Interest",
          "val1": "1.57",
          "val2": "2.97",
          "chgp": "-47.14%",
          "chgp_class": "positive"
        },
        {
          "field": "Exceptional Items",
          "val1": "-11.99",
          "val2": "0.00",
          "chgp": "",
          "chgp_class": "neutral"
        },
        {
          "field": "Standalone Net Profit",
          "val1": "164.38",
          "val2": "155.54",
          "chgp": "5.68%",
          "chgp_class": "positive"
        },
        {
          "field": "Operating Profit Margin (Excl OI)",
          "val1": "10.89%",
          "val2": "10.59%",
          "chgp": "0.30%",
          "chgp_class": "positive"
        }
      ]
    }
  }
]

Quarterly Results Snapshot (Standalone) - Jun'26 - YoYstock-summary

Jun'26
Jun'25
Change(%)
Net Sales
516.82
489.38
5.61%
Operating Profit (PBDIT) excl Other Income
59.90
47.88
25.10%
Interest
0.42
0.39
7.69%
Exceptional Items
0.00
0.00
Standalone Net Profit
45.60
35.72
27.66%
Operating Profit Margin (Excl OI)
11.59%
9.78%
1.81%
Values in Rs Cr.
Direction Arrows
Net Sales

YoY Growth in quarter ended Jun 2026 is 5.61% vs -0.63% in Jun 2025

Direction Arrows
Standalone Net Profit

YoY Growth in quarter ended Jun 2026 is 27.66% vs 4.90% in Jun 2025

Half Yearly Results Snapshot (Standalone) - Sep'25stock-summary

Sep'25
Sep'24
Change(%)
Net Sales
951.14
987.15
-3.65%
Operating Profit (PBDIT) excl Other Income
96.16
99.92
-3.76%
Interest
0.74
1.66
-55.42%
Exceptional Items
0.00
0.00
Standalone Net Profit
71.68
70.03
2.36%
Operating Profit Margin (Excl OI)
10.11%
10.12%
-0.01%
Values in Rs Cr.
Direction Arrows
Net Sales

Growth in half year ended Sep 2025 is -3.65% vs -11.57% in Sep 2024

Direction Arrows
Standalone Net Profit

Growth in half year ended Sep 2025 is 2.36% vs -15.53% in Sep 2024

Nine Monthly Results Snapshot (Standalone) - Dec'25stock-summary

Dec'25
Dec'24
Change(%)
Net Sales
1,513.43
1,517.89
-0.29%
Operating Profit (PBDIT) excl Other Income
160.04
157.39
1.68%
Interest
1.15
2.34
-50.85%
Exceptional Items
-11.99
0.00
Standalone Net Profit
110.49
109.61
0.80%
Operating Profit Margin (Excl OI)
10.57%
10.37%
0.20%
Values in Rs Cr.
Direction Arrows
Net Sales

YoY Growth in nine months ended Dec 2025 is -0.29% vs -8.43% in Dec 2024

Direction Arrows
Standalone Net Profit

YoY Growth in nine months ended Dec 2025 is 0.80% vs -10.20% in Dec 2024

Annual Results Snapshot (Standalone) - Mar'26stock-summary

Mar'26
Mar'25
Change(%)
Net Sales
2,177.73
2,077.54
4.82%
Operating Profit (PBDIT) excl Other Income
237.06
220.02
7.74%
Interest
1.57
2.97
-47.14%
Exceptional Items
-11.99
0.00
Standalone Net Profit
164.38
155.54
5.68%
Operating Profit Margin (Excl OI)
10.89%
10.59%
0.30%
Values in Rs Cr.
Direction Arrows
Net Sales

YoY Growth in year ended Mar 2026 is 4.82% vs -6.80% in Mar 2025

Direction Arrows
Standalone Net Profit

YoY Growth in year ended Mar 2026 is 5.68% vs -6.39% in Mar 2025

stock-summaryCompany CV
About Automotive Axles Ltd stock-summary
stock-summary
Automotive Axles Ltd
Small Cap
Auto Components & Equipments
Automotive Axles Limited is a joint venture company incorporated in 1981, between Bharat Forge Limited, Pune, India and Meritor Heavy Vehicle Systems LLC, USA (35.52% equity stake). The Company is the largest independent manufacturer of Rear Drive Axle Assemblies in the country and is primarily engaged in manufacturing of Axles and Brakes at Mysore, Rudrapur and Jamshedpur. The Company's Rs 30.3- Cr. project at Hootagali near Mysore, commenced commercial production in Jul.'84.
Company Coordinates stock-summary
Company Details
Hootagalli Industrial Area, Off Hunsur Road Mysore Karnataka : 570018
stock-summary
Tel: 91-0821-7197500
stock-summary
sec@autoaxle.com
Registrar Details
Integrated Enterprises (India) Ltd , 30, Ramana Residency, 4th Cross, Sampige Road, Malleswaram, Bangalore