MM Forgings

  • Market Cap: Small Cap
  • Industry: Auto Components & Equipments
  • ISIN: INE227C01017
  • NSEID: MMFL
  • BSEID: 522241
INR
628.55
9.95 (1.61%)
BSENSE

Sep 18, 03:30 PM

BSE+NSE Vol: 42.39 k

  • Price Points
  • Score
  • Mojo Parameters
  • Total Return
  • News and Corporate Actions
  • Key factors
  • Shareholding
  • Financials
  • CompanyCV
stock-summaryPrice Point
High/Low

1Day

52 Week

Valuation
Technical
Day's Volume

CASH

42.39 k (-58.53%) Volume

Shareholding (Jun 2026)

FII

2.44%

Held by 39 FIIs

DII

7.49%

Held by 8 DIIs

Promoter

56.34%

Why is MM Forgings Ltd. falling/rising?

06-Sep-2026

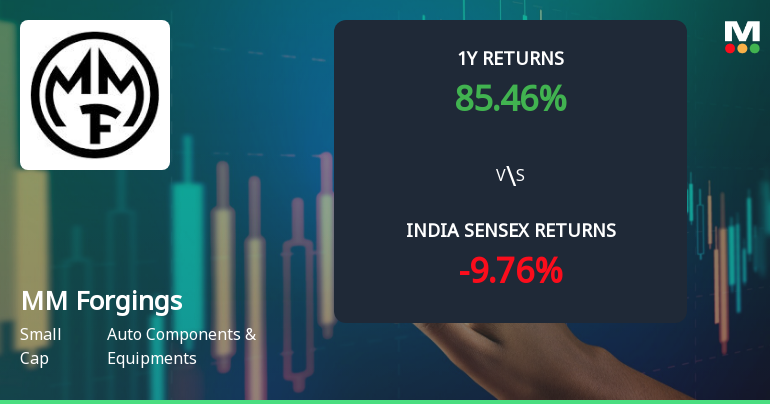
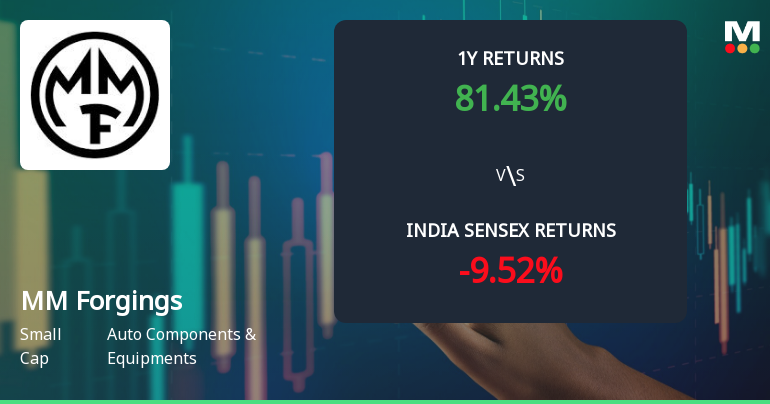
As of 05-Sep, MM Forgings Ltd. is experiencing a stock price decline to Rs 629.10, down 2.06%, due to factors like underperformance in its sector, reduced investor participation, and trading below moving averages, indicating short-term weakness despite strong long-term returns.

As of 05-Sep, MM Forgings Ltd. is experiencing a decline in its stock price, currently at Rs 629.10, which reflects a change of -13.2 (-2.06%). This downward movement can be attributed to several factors. Notably, the stock has underperformed its sector by -0.49% today and has been on a consecutive decline for the last three days, accumulating a total drop of -3.75% during this period. Additionally, the stock reached an intraday low of Rs 620.7, indicating significant selling pressure.<BR><BR>Investor participation has also decreased, with delivery volume falling by -35.03% compared to the five-day average, suggesting a lack of confidence among investors. Although the stock has shown strong performance over the longer term, with a remarkable 98.45% return over the past year, the recent trends indicate a short-term weakness. The stock is trading below its 5-day and 20-day moving averages, which typically signals a bearish trend. <BR><BR>Overall, the combination of recent price declines, reduced investor participation, and underperformance relative to the sector contributes to the current falling price of MM Forgings Ltd.

View full answer

Who are in the management team of MM Forgings?

01-Sep-2026

The management team of MM Forgings includes Chairman N Srinivasan, Vice Chairman Vidyashankar Krishnan, Joint Managing Director K Venkatramanan, and several independent directors, all of whom guide the company's strategic direction and governance.

The management team of MM Forgings includes the following members:<BR><BR>1. **N Srinivasan** - Chairman & Independent Director<BR>2. **V Vaidyanathan** - Independent Director<BR>3. **Vidyashankar Krishnan** - Vice Chairman & Managing Director<BR>4. **K Venkatramanan** - Joint Managing Director<BR>5. **A Gopalakrishnan** - Independent Director<BR>6. **Kavitha Vijay** - Independent Director<BR>7. **Sumita Vidyashankar** - Director<BR>8. **Chandrasekar. S** - Company Secretary & Compliance Officer<BR>9. **Shankar Athreya** - Independent Director<BR>10. **Hari Sankaran** - Independent Director<BR><BR>This team plays a crucial role in guiding the company's strategic direction and governance.

View full answer

What does MM Forgings do?

01-Sep-2026

MM Forgings Ltd. manufactures steel forgings for the Auto Components industry and has a market cap of INR 3,009 Cr. Founded in 1946, the company reported net sales of 420 Cr and a net profit of 90 Cr for June 2026.

Overview:<BR>MM Forgings Ltd. is engaged in the manufacture of steel forgings and operates within the Auto Components & Equipments industry, categorized as a Small Cap company.<BR><BR>History:<BR>MM Forgings Limited was incorporated in 1946 and went public in 1975. The company, originally known as Madras Motors Private Limited, diversified from dealing in imported motorcycles to establishing steel forging plants and changed its name to MM Forgings on April 1, 1993. The latest quarterly results report net sales and net profit for June 2026.<BR><BR>Financial Snapshot:<BR>- Net Sales: 420 Cr (Quarterly Results - Jun 2026)<BR>- Net Profit: 90 Cr (Quarterly Results - Jun 2026)<BR>- Market Cap: INR 3,009 Cr (Small Cap)<BR><BR>Key Metrics:<BR>- P/E: 19.00<BR>- Industry P/E: 50<BR>- Dividend Yield: 0.61%<BR>- Debt-Equity: 0.87<BR>- Return on Equity: 10.03%<BR>- Price to Book: 3.22<BR><BR>Contact Details:<BR>Address: SVK Tower A/24/25 Guindy, Thiru Vi Ka Industrial Estate Chennai Tamil Nadu : 600032 <BR>Tel: 91-44-71601000 <BR>Email: mmforge@mmforgings.com <BR>Website: http://www.mmforgings.com

View full answer

Who are the peers of the MM Forgings?

01-Sep-2026

MM Forgings' peers include Divgi Torq, JTEKT India, Federal-Mogul Go, Carraro India, Rane (Madras), Sundaram Clayton, Automotive Axles, Rajratan Global, and Talbros Auto. MM Forgings has the highest 1-year return at 105.71%, significantly outperforming its peers.

Peers: The peers of MM Forgings are Divgi Torq, JTEKT India, Federal-Mogul Go, Carraro India, Rane (Madras), Sundaram Clayton, Automotive Axles, Rajratan Global, and Talbros Auto.<BR><BR>Quality Snapshot: Excellent management risk is observed at Carraro India and Automotive Axles, while Good management risk is found at JTEKT India, Rajratan Global, and the rest. Average management risk is present at Divgi Torq, Federal-Mogul Go, Rane (Madras), MM Forgings, and Talbros Auto, while Below Average management risk is noted at Sundaram Clayton. Growth is Excellent at Rane (Madras), Good at Carraro India and Automotive Axles, and Below Average at Divgi Torq, JTEKT India, Federal-Mogul Go, MM Forgings, Sundaram Clayton, and Talbros Auto, with the rest showing Average growth. Capital Structure is Excellent at Divgi Torq, JTEKT India, and Federal-Mogul Go, Good at Carraro India, Rajratan Global, and Talbros Auto, Average at MM Forgings, and Below Average at Rane (Madras) and Sundaram Clayton.<BR><BR>Return Snapshot: The peer with the highest 1-year return is MM Forgings at 105.71%, while the lowest is Sundaram Clayton at -21.39%. MM Forgings' return significantly outperforms all peers. Additionally, Automotive Axles and Sundaram Clayton are among the peers whose six-month return is negative.

View full answer

How big is MM Forgings?

01-Sep-2026

As of 31st August, MM Forgings Ltd. has a market capitalization of 3,009.00 Cr, with net sales of 1,648.71 Cr and a net profit of 169.30 Cr reported in the latest four quarters. The company has shareholder's funds of 975.22 Cr and total assets of 2,496.29 Cr for the annual period ending in March 2026.

As of 31st August, MM Forgings Ltd. has a market capitalization of 3,009.00 Cr, categorizing it as a Small Cap company.<BR><BR>In the latest four quarters, MM Forgings reported net sales of 1,648.71 Cr and a net profit of 169.30 Cr.<BR><BR>For the latest annual period ending in March 2026, the company reported shareholder's funds of 975.22 Cr and total assets of 2,496.29 Cr.

View full answer

Should I buy, sell or hold MM Forgings Ltd.?

19-Aug-2026

When is the next results date for MM Forgings Ltd.?

04-Aug-2026

The next results date for MM Forgings Ltd. is 14 August 2026.

The next results date for MM Forgings Ltd. is scheduled for 14 August 2026.

View full answer

Are MM Forgings Ltd. latest results good or bad?

29-May-2026

MM Forgings Ltd. reported a strong net profit increase of 154.64% and 15.93% revenue growth in Q4 FY26, but faced challenges with declining operating margins and a high debt-to-equity ratio, leading to mixed results overall. Investors may see positives in growth but should be cautious about profitability and leverage risks.

MM Forgings Ltd. has reported mixed results for Q4 FY26. On the positive side, the company saw a significant rebound in net profit, which rose by 154.64% quarter-on-quarter to ₹44.74 crores. This improvement is notable compared to the previous quarter's profit of ₹17.57 crores and reflects strong revenue growth of 15.93% year-on-year, reaching ₹429.66 crores.<BR><BR>However, there are concerns regarding profitability as the operating margin, excluding other income, contracted to 18.83% from 19.71% in the same quarter last year. This decline indicates ongoing cost pressures, particularly in raw materials and employee expenses, which are affecting the company's ability to maintain margins despite rising revenues.<BR><BR>Additionally, the company's return on equity (ROE) of 16.10% is above the peer average, suggesting effective use of shareholder capital, but it is accompanied by a high debt-to-equity ratio of 1.06. This elevated leverage poses risks, especially given the rising interest burden, which consumed a larger portion of operating profit.<BR><BR>In summary, while MM Forgings has shown strong revenue growth and a significant profit rebound, the contraction in operating margins and high debt levels highlight ongoing challenges. Investors may view the results as a mixed bag, with positive growth trends tempered by concerns over profitability and financial leverage.

View full answer

Has MM Forgings Ltd. declared dividend?

29-May-2026

Yes, MM Forgings Ltd. has declared a dividend of 40% (₹4 per share) with an ex-date of June 12, 2026. The company has shown varying total returns, with a notable 93.38% total return over the last 5 years.

MM Forgings Ltd. has declared a dividend.<BR><BR>Dividend Details:<BR>- Percentage announced: 40%<BR>- Amount per share: 4<BR>- Ex-date: 12 Jun 26<BR><BR>Dividend Yield: 0.87%.<BR><BR>Total Returns by Period:<BR>Over the last 3 months, the price return was -2.43%, the dividend return was 0.89%, resulting in a total return of -1.54%.<BR><BR>In the 6-month period, the price return was 36.87%, the dividend return was 1.22%, leading to a total return of 38.09%.<BR><BR>For the 1-year period, the price return was 19.76%, the dividend return was 2.23%, culminating in a total return of 21.99%.<BR><BR>Over the 2-year period, the price return was -29.48%, the dividend return was 2.63%, resulting in a total return of -26.85%.<BR><BR>In the 3-year period, the price return was 4.7%, the dividend return was 3.73%, leading to a total return of 8.43%.<BR><BR>For the 4-year period, the price return was 14.59%, the dividend return was 5.53%, resulting in a total return of 20.12%.<BR><BR>Finally, over the 5-year period, the price return was 83.48%, the dividend return was 9.90%, culminating in a total return of 93.38%.<BR><BR>Overall, MM Forgings Ltd. has declared a significant dividend and has shown varying total returns across different periods, with a notable positive trend in the longer-term returns, particularly over the last 5 years.

View full answer

Is MM Forgings technically bullish or bearish?

04-Dec-2025

As of December 3, 2025, MM Forgings shows a neutral technical stance with mixed signals, indicating a shift from mildly bearish to sideways, as weekly indicators are mildly bullish while monthly indicators remain bearish.

As of 3 December 2025, the technical trend for MM Forgings has changed from mildly bearish to sideways. The current technical stance is neutral, with mixed signals across different indicators. The weekly MACD and KST are mildly bullish, while the monthly MACD and KST are bearish. The Bollinger Bands show a bullish signal on the weekly chart but mildly bearish on the monthly. Daily moving averages indicate a mildly bearish trend. The Dow Theory supports a mildly bullish stance on both weekly and monthly time frames. Overall, the strength of the current trend is weak, with no strong bullish or bearish signals.

View full answer

How has been the historical performance of MM Forgings?

17-Nov-2025

MM Forgings has experienced fluctuating financial performance, with net sales decreasing to 1,525.18 Cr in March 2025 from 1,563.07 Cr in March 2024, while total assets and liabilities rose significantly. Despite a slight increase in operating profit, both profit before tax and profit after tax declined, indicating challenges in profitability.

Answer:<BR>The historical performance of MM Forgings shows a fluctuating trend in net sales and profits over the years, with a net sales figure of 1,525.18 Cr in March 2025, down from 1,563.07 Cr in March 2024, but up from 1,461.88 Cr in March 2023. The total operating income followed a similar pattern, reaching 1,525.18 Cr in March 2025. The company experienced an increase in total expenditure, which was 1,229.10 Cr in March 2025, compared to 1,270.23 Cr in March 2024. Operating profit (PBDIT) slightly increased to 318.73 Cr in March 2025 from 313.33 Cr in March 2024, while profit before tax decreased to 165.68 Cr in March 2025 from 187.95 Cr in March 2024. Profit after tax also saw a decline to 121.81 Cr in March 2025 from 133.49 Cr in March 2024. The earnings per share (EPS) decreased to 25.24 in March 2025 from 27.92 in March 2024. <BR><BR>In terms of assets and liabilities, total assets rose to 2,348.97 Cr in March 2025 from 1,969.01 Cr in March 2024, while total liabilities also increased to 2,348.97 Cr in March 2025 from 1,969.01 Cr in March 2024. The company's total debt rose to 1,185.24 Cr in March 2025 from 930.84 Cr in March 2024. Cash flow from operating activities improved to 181.00 Cr in March 2025 from 148.00 Cr in March 2024, while cash flow from investing activities worsened to -358.00 Cr in March 2025 from -232.00 Cr in March 2024. The net cash inflow was 8.00 Cr in March 2025, compared to a net outflow of -6.00 Cr in March 2024.<BR><BR>Breakdown:<BR>MM Forgings has shown a mixed performance over the years, with net sales peaking at 1,563.07 Cr in March 2024 before declining to 1,525.18 Cr in March 2025. The total operating income mirrored this trend, while total expenditure increased to 1,229.10 Cr in March 2025. Operating profit (PBDIT) saw a slight rise, indicating stable operational efficiency, but profit before tax and profit after tax both decreased in March 2025 compared to the previous year. The company's total assets and liabilities both grew significantly, reflecting an increase in financial commitments and investments. Cash flow from operating activities improved, suggesting better cash management, although cash flow from investing activities deteriorated, indicating higher capital expenditures. Overall, while MM Forgings has faced challenges in profitability, its asset base and operational cash flow show resilience.

View full answer

Is MM Forgings overvalued or undervalued?

09-Jun-2025

As of July 3, 2023, MM Forgings is considered fairly valued with a PE ratio of 15.21 and has underperformed the Sensex with a return of -34.84%, suggesting it may be undervalued compared to peers like Bharat Forge and CIE Automotive.

As of 3 July 2023, the valuation grade for MM Forgings has moved from very attractive to attractive, indicating a shift in market perception. The company is currently considered fairly valued. Key ratios include a PE ratio of 15.21, an EV to EBITDA of 9.08, and a ROE of 13.66%. <BR><BR>In comparison to peers, Bharat Forge has a significantly higher PE ratio of 59.98, while CIE Automotive, also attractive, has a PE of 21.15. This suggests that MM Forgings is priced more conservatively relative to its peers. Notably, the stock has underperformed relative to the Sensex over the past year, with a return of -34.84% compared to the Sensex's 7.60%, reinforcing the notion that the stock may be undervalued in the current market context.

View full answer

Who are the top shareholders of the MM Forgings?

06-Jun-2025

The top shareholders of MM Forgings include Synmax Consultants And Trading Pvt Ltd with 24.01%, mutual funds at 7.81% (led by HDFC Hybrid Equity Fund at 3.72%), and Foreign Institutional Investors holding 3.09%. There are no pledged promoter holdings.

The top shareholders of MM Forgings include the promoters, with Synmax Consultants And Trading Pvt Ltd holding the highest stake at 24.01%. Additionally, mutual funds collectively hold 7.81% of the company, with HDFC Mutual Fund - HDFC Hybrid Equity Fund being the largest public shareholder at 3.72%. Foreign Institutional Investors (FIIs) also have a presence, holding 3.09% through 36 different entities. There are no pledged promoter holdings reported.

View full answer

What is the bonus history of the MM Forgings?

06-Jun-2025

MM Forgings has issued bonus shares multiple times, with the most recent 1:1 bonus announced for July 16, 2024. Previous bonuses were also 1:1, issued on July 18, 2018, and September 26, 2008, demonstrating the company's commitment to rewarding shareholders.

MM Forgings has a history of issuing bonus shares on several occasions. The most recent bonus issue was a 1:1 bonus announced with an ex-date of July 16, 2024. Prior to that, the company issued a 1:1 bonus on July 18, 2018, and another 1:1 bonus on September 26, 2008. Each of these bonus issues reflects the company's practice of rewarding its shareholders.

View full answer
iScoreScore
Part of MojoOne Strategy
Click here to find our call on this stock
Strong Sell
Sell
Hold
Buy
Strong Buy

Dashboard

1

Poor long term growth as Net Sales has grown by an annual rate of 12.23% and Operating profit at 11.79% over the last 5 years

 
2

Positive results in Jun 26

3

With ROCE of 9.7, it has a Fair valuation with a 2.1 Enterprise value to Capital Employed

4

Majority shareholders : Promoters

 
5

Market Beating performance in long term as well as near term

stock-summaryMojo Parameters

Mojo Parameters

Loading Valuation Snapshot...

Stock DNA

stock-summary
Industry

Auto Components & Equipments

stock-summary
Market cap

INR 3,007 Cr (Small Cap)

stock-summary
P/E

18.00

stock-summary
Industry P/E

47

stock-summary
Dividend Yield

0.65%

stock-summary
Debt Equity

0.87

stock-summary
Return on Equity

10.03%

stock-summary
Price to Book

3.06

Revenue and Profits:
Net Sales:
420 Cr
(Quarterly Results - Jun 2026)
Net Profit:
90 Cr
stock-summaryTotal Returns
Total Returns (Price + Dividend) stock-summary
Dividend Yield (0.65%)
TimePeriod
Price Return
Dividend Return
Total Return
3 Months
33.34%
0%
33.34%
6 Months
44.44%
0.97%
45.41%
1 Year
87.94%
1.24%
89.18%
2 Years
6.62%
1.33%
7.95%
3 Years
38.38%
2.74%
41.12%
4 Years
50.49%
3.62%
54.11%
5 Years
51.41%
3.90%
55.31%

Latest dividend: 4 per share ex-dividend date: Jun-12-2026

Risk Adjusted Returns v/s stock-summary
Returns Beta
Icon
Beta has not been calculated since enough price history is not available
stock-summaryNews & Corporate Actions

News

Announcements stock-summary

MM Forgings Limited - Other General Purpose

13-Nov-2019 | Source : NSE

MM Forgings Limited has informed the Exchange regarding disclosure of Related Party Transactions, for the half year ended September 30, 2019.

MM Forgings Limited - Updates

06-Nov-2019 | Source : NSE

MM Forgings Limited has informed the Exchange regarding '1. Please find enclosed, details of share certificates demitted/ remated for the month of October 2019, with NSDL and CDSL together with details thereof as made available to us by our Share Transfer Agents, M/s Cameo Corporate Services Limited. This is in compliance with Regulation 54 (5) of the SEBI ( Depository s & Participants) Regulations 1996.

MM Forgings Limited - Updates

31-Oct-2019 | Source : NSE

MM Forgings Limited has informed the Exchange regarding 'enclosed the advertisement clippings of the Notice of the Board Meeting, to consider and approve the unaudited standalone and consolidated financial results for the quarter ended 30 September 2019, published in Trinity Mirror and Makkal kural.

Corporate Actions stock-summary

stock-summary
BOARD MEETING

No Upcoming Board Meetings

stock-summary
DIVIDEND

MM Forgings Ltd. has declared 40% dividend, ex-date: 12 Jun 26

stock-summary
SPLITS

No Splits history available

stock-summary
BONUS

MM Forgings Ltd. has announced 1:1 bonus issue, ex-date: 16 Jul 24

stock-summary
RIGHTS

No Rights history available

stock-summaryKey Factors

Quality key factors stock-summary

Factor
Value
Sales Growth (5y)
12.23%
EBIT Growth (5y)
11.79%
EBIT to Interest (avg)
4.31
Debt to EBITDA (avg)
3.29
Net Debt to Equity (avg)
0.87
Sales to Capital Employed (avg)
0.89
Tax Ratio
7.06%
Dividend Payout Ratio
19.57%
Pledged Shares
0
Institutional Holding
9.93%
ROCE (avg)
13.01%
ROE (avg)
15.19%

Valuation key factors

Factor
Value
P/E Ratio
18
Industry P/E
47
Price to Book Value
3.11
EV to EBIT
21.17
EV to EBITDA
13.34
EV to Capital Employed
2.13
EV to Sales
2.36
PEG Ratio
0.34
Dividend Yield
0.64%
ROCE (Latest)
9.69%
ROE (Latest)
10.03%

Technicals key factors

Indicator
Weekly
Monthly
MACD
Bullish
Bullish
RSI
Bearish
No Signal
Bollinger Bands
Mildly Bullish
Mildly Bullish
Moving Averages
Bullish (Daily)
KST
Bullish
Bullish
Dow Theory
Mildly Bearish
No Trend
OBV
No Trend
No Trend
stock-summary Technical Indicator Scale: Bearish, Mildly Bearish, Sideways, Mildly Bullish, Bullish  Turned 
stock-summaryShareholding
Shareholding Snapshot : Jun 2026stock-summary
Shareholding Compare (%holding) stock-summary
Majority shareholders

Promoters

Pledged Promoter Holdings

None

Mutual Funds

Held by 4 Schemes (7.13%)

FIIs

Held by 39 FIIs (2.44%)

Promoter with highest holding

Synmax Consultants And Trading Pvt Ltd (24.01%)

Highest Public shareholder

Hdfc Mutual Fund (3.74%)

Individual Investors Holdings

27.14%

stock-summaryFinancial
[
  {
    "link": "quarterly",
    "btn_text": "All Quarterly Results",
    "header": "Quarterly Results Snapshot (Consolidated) - Jun'26 - QoQ",
    "rhs": [
      {
        "prefix": "Net Sales ",
        "suffix": "QoQ Growth in quarter ended Jun 2026 is -2.14% vs 3.87% in Mar 2026",
        "dir": -1
      },
      {
        "prefix": "Consolidated Net Profit ",
        "suffix": "QoQ Growth in quarter ended Jun 2026 is 102.10% vs 154.64% in Mar 2026",
        "dir": -1
      }
    ],
    "table": {
      "header": [
        "Jun'26",
        "Mar'26",
        "Change(%)"
      ],
      "body": [
        {
          "field": "Net Sales",
          "val1": "420.48",
          "val2": "429.66",
          "chgp": "-2.14%",
          "chgp_class": "negative"
        },
        {
          "field": "Operating Profit (PBDIT) excl Other Income",
          "val1": "74.94",
          "val2": "80.80",
          "chgp": "-7.25%",
          "chgp_class": "negative"
        },
        {
          "field": "Interest",
          "val1": "16.27",
          "val2": "18.31",
          "chgp": "-11.14%",
          "chgp_class": "positive"
        },
        {
          "field": "Exceptional Items",
          "val1": "0.00",
          "val2": "0.00",
          "chgp": "",
          "chgp_class": "neutral"
        },
        {
          "field": "Consolidate Net Profit",
          "val1": "90.42",
          "val2": "44.74",
          "chgp": "102.10%",
          "chgp_class": "positive"
        },
        {
          "field": "Operating Profit Margin (Excl OI)",
          "val1": "18.28%",
          "val2": "18.83%",
          "chgp": "-0.55%",
          "chgp_class": "negative"
        }
      ]
    }
  },
  {
    "link": "half-yearly",
    "btn_text": "All Half Yearly Results",
    "header": "Half Yearly Results Snapshot (Consolidated) - Sep'25",
    "rhs": [
      {
        "prefix": "Net Sales ",
        "suffix": " Growth in half year ended Sep 2025 is -4.34% vs 1.78% in Sep 2024",
        "dir": -1
      },
      {
        "prefix": "Consolidated Net Profit ",
        "suffix": " Growth in half year ended Sep 2025 is -42.34% vs -3.77% in Sep 2024",
        "dir": -1
      }
    ],
    "table": {
      "header": [
        "Sep'25",
        "Sep'24",
        "Change(%)"
      ],
      "body": [
        {
          "field": "Net Sales",
          "val1": "746.58",
          "val2": "780.46",
          "chgp": "-4.34%",
          "chgp_class": "negative"
        },
        {
          "field": "Operating Profit (PBDIT) excl Other Income",
          "val1": "129.85",
          "val2": "150.08",
          "chgp": "-13.48%",
          "chgp_class": "negative"
        },
        {
          "field": "Interest",
          "val1": "39.54",
          "val2": "30.65",
          "chgp": "29.00%",
          "chgp_class": "negative"
        },
        {
          "field": "Exceptional Items",
          "val1": "0.00",
          "val2": "0.00",
          "chgp": "",
          "chgp_class": "neutral"
        },
        {
          "field": "Consolidate Net Profit",
          "val1": "35.76",
          "val2": "62.02",
          "chgp": "-42.34%",
          "chgp_class": "negative"
        },
        {
          "field": "Operating Profit Margin (Excl OI)",
          "val1": "17.74%",
          "val2": "19.52%",
          "chgp": "-1.78%",
          "chgp_class": "negative"
        }
      ]
    }
  },
  {
    "link": "nine-monthly",
    "btn_text": "All Nine Monthly Results",
    "header": "Nine Monthly Results Snapshot (Consolidated) - Dec'25",
    "rhs": [
      {
        "prefix": "Net Sales ",
        "suffix": "YoY Growth in nine months ended Dec 2025 is 0.49% vs -0.95% in Dec 2024",
        "dir": 1
      },
      {
        "prefix": "Consolidated Net Profit ",
        "suffix": "YoY Growth in nine months ended Dec 2025 is -39.79% vs -9.61% in Dec 2024",
        "dir": -1
      }
    ],
    "table": {
      "header": [
        "Dec'25",
        "Dec'24",
        "Change(%)"
      ],
      "body": [
        {
          "field": "Net Sales",
          "val1": "1,160.22",
          "val2": "1,154.55",
          "chgp": "0.49%",
          "chgp_class": "positive"
        },
        {
          "field": "Operating Profit (PBDIT) excl Other Income",
          "val1": "199.19",
          "val2": "223.21",
          "chgp": "-10.76%",
          "chgp_class": "negative"
        },
        {
          "field": "Interest",
          "val1": "59.89",
          "val2": "46.14",
          "chgp": "29.80%",
          "chgp_class": "negative"
        },
        {
          "field": "Exceptional Items",
          "val1": "0.00",
          "val2": "0.00",
          "chgp": "",
          "chgp_class": "neutral"
        },
        {
          "field": "Consolidate Net Profit",
          "val1": "53.33",
          "val2": "88.57",
          "chgp": "-39.79%",
          "chgp_class": "negative"
        },
        {
          "field": "Operating Profit Margin (Excl OI)",
          "val1": "17.17%",
          "val2": "19.33%",
          "chgp": "-2.16%",
          "chgp_class": "negative"
        }
      ]
    }
  },
  {
    "link": "annual",
    "btn_text": "All Annual Results",
    "header": "Annual Results Snapshot (Consolidated) - Mar'26",
    "rhs": [
      {
        "prefix": "Net Sales ",
        "suffix": "YoY Growth in year ended Mar 2026 is 4.24% vs -2.42% in Mar 2025",
        "dir": 1
      },
      {
        "prefix": "Consolidated Net Profit ",
        "suffix": "YoY Growth in year ended Mar 2026 is -19.03% vs -9.60% in Mar 2025",
        "dir": -1
      }
    ],
    "table": {
      "header": [
        "Mar'26",
        "Mar'25",
        "Change(%)"
      ],
      "body": [
        {
          "field": "Net Sales",
          "val1": "1,589.87",
          "val2": "1,525.18",
          "chgp": "4.24%",
          "chgp_class": "positive"
        },
        {
          "field": "Operating Profit (PBDIT) excl Other Income",
          "val1": "279.98",
          "val2": "296.08",
          "chgp": "-5.44%",
          "chgp_class": "negative"
        },
        {
          "field": "Interest",
          "val1": "78.20",
          "val2": "59.79",
          "chgp": "30.79%",
          "chgp_class": "negative"
        },
        {
          "field": "Exceptional Items",
          "val1": "0.00",
          "val2": "0.00",
          "chgp": "",
          "chgp_class": "neutral"
        },
        {
          "field": "Consolidate Net Profit",
          "val1": "98.67",
          "val2": "121.86",
          "chgp": "-19.03%",
          "chgp_class": "negative"
        },
        {
          "field": "Operating Profit Margin (Excl OI)",
          "val1": "17.80%",
          "val2": "19.60%",
          "chgp": "-1.80%",
          "chgp_class": "negative"
        }
      ]
    }
  }
]

Quarterly Results Snapshot (Consolidated) - Jun'26 - QoQstock-summary

Jun'26
Mar'26
Change(%)
Net Sales
420.48
429.66
-2.14%
Operating Profit (PBDIT) excl Other Income
74.94
80.80
-7.25%
Interest
16.27
18.31
-11.14%
Exceptional Items
0.00
0.00
Consolidate Net Profit
90.42
44.74
102.10%
Operating Profit Margin (Excl OI)
18.28%
18.83%
-0.55%
Values in Rs Cr.
Direction Arrows
Net Sales

QoQ Growth in quarter ended Jun 2026 is -2.14% vs 3.87% in Mar 2026

Direction Arrows
Consolidated Net Profit

QoQ Growth in quarter ended Jun 2026 is 102.10% vs 154.64% in Mar 2026

Half Yearly Results Snapshot (Consolidated) - Sep'25stock-summary

Sep'25
Sep'24
Change(%)
Net Sales
746.58
780.46
-4.34%
Operating Profit (PBDIT) excl Other Income
129.85
150.08
-13.48%
Interest
39.54
30.65
29.00%
Exceptional Items
0.00
0.00
Consolidate Net Profit
35.76
62.02
-42.34%
Operating Profit Margin (Excl OI)
17.74%
19.52%
-1.78%
Values in Rs Cr.
Direction Arrows
Net Sales

Growth in half year ended Sep 2025 is -4.34% vs 1.78% in Sep 2024

Direction Arrows
Consolidated Net Profit

Growth in half year ended Sep 2025 is -42.34% vs -3.77% in Sep 2024

Nine Monthly Results Snapshot (Consolidated) - Dec'25stock-summary

Dec'25
Dec'24
Change(%)
Net Sales
1,160.22
1,154.55
0.49%
Operating Profit (PBDIT) excl Other Income
199.19
223.21
-10.76%
Interest
59.89
46.14
29.80%
Exceptional Items
0.00
0.00
Consolidate Net Profit
53.33
88.57
-39.79%
Operating Profit Margin (Excl OI)
17.17%
19.33%
-2.16%
Values in Rs Cr.
Direction Arrows
Net Sales

YoY Growth in nine months ended Dec 2025 is 0.49% vs -0.95% in Dec 2024

Direction Arrows
Consolidated Net Profit

YoY Growth in nine months ended Dec 2025 is -39.79% vs -9.61% in Dec 2024

Annual Results Snapshot (Consolidated) - Mar'26stock-summary

Mar'26
Mar'25
Change(%)
Net Sales
1,589.87
1,525.18
4.24%
Operating Profit (PBDIT) excl Other Income
279.98
296.08
-5.44%
Interest
78.20
59.79
30.79%
Exceptional Items
0.00
0.00
Consolidate Net Profit
98.67
121.86
-19.03%
Operating Profit Margin (Excl OI)
17.80%
19.60%
-1.80%
Values in Rs Cr.
Direction Arrows
Net Sales

YoY Growth in year ended Mar 2026 is 4.24% vs -2.42% in Mar 2025

Direction Arrows
Consolidated Net Profit

YoY Growth in year ended Mar 2026 is -19.03% vs -9.60% in Mar 2025

stock-summaryCompany CV
About MM Forgings Ltd. stock-summary
stock-summary
MM Forgings Ltd.
Small Cap
Auto Components & Equipments
MM Forgings Limited (Formerly known Madras Motors Private Limited) was incorporated in 1946. The Company went public in 1975. Originally dealing in imported motorcycles, it later diversified to establish steel forging plants. The company changed to its present name, M M Forgings on 1 Apr.'93. It was promoted by S E Krishnan and S R Subramanian. The Company is engaged in the manufacture of Steel Forgings.
Company Coordinates stock-summary
Company Details
SVK Tower A/24/25 Guindy, Thiru Vi Ka Industrial Estate Chennai Tamil Nadu : 600032
stock-summary
Tel: 91-44-71601000
stock-summary
mmforge@mmforgings.com
Registrar Details
Cameo Corporate Services Ltd , Subramanian Buildings No 1 , Club House Road, Chennai