Andhra Paper

  • Market Cap: Micro Cap
  • Industry: Paper, Forest & Jute Products
  • ISIN: INE435A01051
  • NSEID: ANDHRAPAP
  • BSEID: 502330
INR
61.88
0.79 (1.29%)
BSENSE

Sep 03, 09:40 AM

BSE+NSE Vol: 72.28 k

  • Price Points
  • Score
  • Mojo Parameters
  • Total Return
  • News and Corporate Actions
  • Key factors
  • Shareholding
  • Financials
  • CompanyCV
stock-summaryPrice Point
High/Low

1Day

52 Week

Valuation
Technical
Day's Volume

CASH

72.28 k (330.87%) Volume

Shareholding (Jun 2026)

FII

0.27%

Held by 23 FIIs

DII

5.48%

Held by 8 DIIs

Promoter

72.45%

Why is Andhra Paper Ltd falling/rising?

03-Sep-2026

As of 02-Sep, Andhra Paper Ltd's stock price is rising to 61.06, driven by short-term gains and sector outperformance, despite a year-to-date decline of 9.08% and reduced investor participation. The stock shows short-term strength but remains below key long-term moving averages.

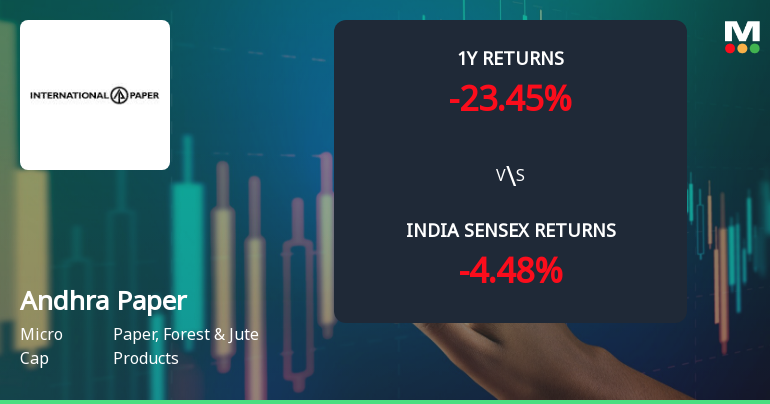
As of 02-Sep, Andhra Paper Ltd's stock price is rising, currently at 61.06, with a change of 0.59 (0.98%) upwards. This increase can be attributed to several factors. Firstly, the stock has outperformed the sector by 1.97% today, indicating a stronger performance relative to its peers. Additionally, it has experienced consecutive gains over the last two days, accumulating a total return of 1.08% during this period.<BR><BR>Despite the positive movement, it is important to note that the stock's performance over longer periods shows a decline, with a year-to-date drop of 9.08% and a significant 23.45% decrease over the past year. Furthermore, while the stock is currently trading above its 5-day and 20-day moving averages, it remains below its 50-day, 100-day, and 200-day moving averages, suggesting that while there is short-term strength, the longer-term trend may still be downward.<BR><BR>Investor participation has also seen a decline, with delivery volume dropping by 40.74% against the 5-day average, which could indicate a lack of confidence among investors. However, the stock remains liquid enough for trading, with a liquidity level based on 2% of the 5-day average traded value.<BR><BR>In summary, the recent rise in Andhra Paper Ltd's stock price is primarily driven by short-term gains and sector outperformance, despite ongoing challenges reflected in its longer-term performance metrics and declining investor participation.

View full answer

Who are in the management team of Andhra Paper?

01-Sep-2026

The management team of Andhra Paper includes S K Bangur (Chairman & Managing Director), Virendraa Bangur (Vice Chairman), Saurabh Bangur (Joint Managing Director), and several independent and non-executive directors, overseeing the company's operations and strategy.

The management team of Andhra Paper includes the following individuals:<BR><BR>1. **S K Bangur** - Chairman & Managing Director<BR>2. **Rajendra Jain** - Non-Executive & Non-Independent Director<BR>3. **Sudarshan V Somani** - Independent Director<BR>4. **Arun Kumar Sureka** - Independent Director<BR>5. **Virendraa Bangur** - Vice Chairman<BR>6. **Saurabh Bangur** - Joint Managing Director<BR>7. **Mukesh Jain** - Director (Commercial)<BR>8. **Sitaram Sharma** - Independent Director<BR>9. **Bijay Kumar Sanku** - Company Secretary & Compliance Officer<BR>10. **Virendra Sinha** - Independent Director<BR>11. **Papia Sengupta** - Independent Director<BR><BR>This team is responsible for overseeing the operations and strategic direction of the company.

View full answer

What does Andhra Paper do?

01-Sep-2026

Andhra Paper Ltd operates in the Paper, Forest & Jute Products industry, with a market cap of INR 1,213 Cr, reporting net sales of 394 Cr and a net profit of 30 Cr for June 2026. The company has a P/E ratio of 43.00 and a dividend yield of 0.82%.

Overview: <BR>Andhra Paper Ltd is a company operating in the Paper, Forest & Jute Products industry, categorized as a Micro Cap.<BR><BR>History: <BR>The company was originally set up by a private entrepreneur and underwent ownership changes twice before being taken over by the Indian Government in 1953. It was established as Andhra Pradesh Paper Mills through an agreement between the Government of Andhra Pradesh and industrialist G D Somani. The latest quarterly results report net sales and profit for June 2026.<BR><BR>Financial Snapshot: <BR>Net Sales: 394 Cr (Quarterly Results - Jun 2026) <BR>Net Profit: 30 Cr (Quarterly Results - Jun 2026) <BR>Market Cap: INR 1,213 Cr (Micro Cap)<BR><BR>Key Metrics: <BR>P/E: 43.00 <BR>Industry P/E: 15 <BR>Dividend Yield: 0.82% <BR>Debt-Equity: -0.15 <BR>Return on Equity: 1.42% <BR>Price to Book: 0.63<BR><BR>Contact Details: <BR>Address: East Godavari District, Rajahmundry, Andhra Pradesh: 533105 <BR>Tel: 91-883-2471831-2471834 <BR>Email: prabhakar.cherukumudi@ipaper.com <BR>Website: http://www.andhrapaper.com

View full answer

Who are the peers of the Andhra Paper?

01-Sep-2026

Andhra Paper's peers include JK Paper, West Coast Paper, KS Smart Technlo, and others. While it has an excellent capital structure, its 1-year return is the lowest among peers at -22.23%.

Peers: The peers of Andhra Paper are JK Paper, West Coast Paper, KS Smart Technlo, Seshasayee Paper, T N Newsprint, Pudumjee Paper, String Metaverse, N R Agarwal Inds, and Emami Paper.<BR><BR>Quality Snapshot: Excellent management risk is observed at JK Paper, West Coast Paper, and Andhra Paper, while Average management risk is found at KS Smart Technlo, Seshasayee Paper, T N Newsprint, Pudumjee Paper, String Metaverse, N R Agarwal Inds, Emami Paper, and the rest. Growth ratings show Excellent growth at KS Smart Technlo and String Metaverse, while Below Average growth is noted at JK Paper, West Coast Paper, Seshasayee Paper, Andhra Paper, Pudumjee Paper, and the rest. For Capital Structure, Excellent capital structure is seen at West Coast Paper, Andhra Paper, and Pudumjee Paper, while Good capital structure is observed at JK Paper, KS Smart Technlo, and String Metaverse, and the rest have Below Average or Average ratings.<BR><BR>Return Snapshot: The peer with the highest 1-year return is N R Agarwal Inds at 23.62%, while the lowest is Andhra Paper at -22.23%. Andhra Paper's 1-year return is significantly lower than its peers. Additionally, peers with negative six-month returns include KS Smart Technlo, Seshasayee Paper, and N R Agarwal Inds.

View full answer

How big is Andhra Paper?

01-Sep-2026

As of 31st August, Andhra Paper Ltd has a market capitalization of 1,213.00 Cr, with recent Net Sales of 1,701.59 Cr and a Net Profit of 27.63 Cr.

As of 31st August, Andhra Paper Ltd has a market capitalization of 1,213.00 Cr, categorizing it as a Micro Cap company.<BR><BR>In the latest four quarters, Andhra Paper reported Net Sales of 1,701.59 Cr and a Net Profit of 27.63 Cr.<BR><BR>The latest annual period for the balance sheet is March 2026, with Shareholder's Funds amounting to 1,939.35 Cr and Total Assets of 2,538.09 Cr.

View full answer

Are Andhra Paper Ltd latest results good or bad?

05-Aug-2026

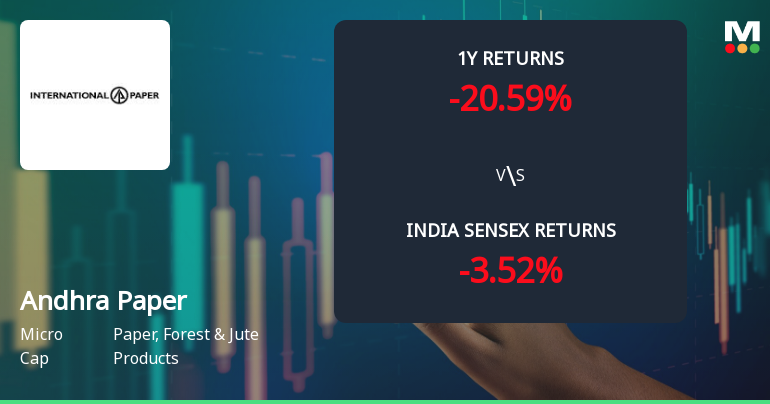
Andhra Paper Ltd's latest results show a mixed performance: while net profit increased by 42.28% quarter-on-quarter, it declined by 42.23% year-on-year, and revenue growth was nearly flat at 0.09%. Investors should be cautious due to the company's significant stock decline and long-term operational challenges.

Andhra Paper Ltd's latest results present a mixed picture. On the positive side, the company reported a net profit of ₹30.32 crore for Q1 FY27, which is a significant increase of 42.28% compared to the previous quarter. Additionally, the operating margin improved dramatically to 12.39%, up from 4.76% in the prior quarter, indicating better operational efficiency.<BR><BR>However, there are notable concerns as well. The company's revenue growth year-on-year was virtually flat at 0.09%, which suggests ongoing challenges in demand or market share. Furthermore, when compared to the same quarter last year, net profit has actually declined by 42.23% from ₹21.31 crore in Q1 FY26. This indicates that while there has been a quarterly recovery, the overall performance compared to last year remains weak.<BR><BR>Moreover, the stock has underperformed significantly, declining 19.90% over the past year, which is concerning given the broader market's relatively stable performance. The company's long-term operational metrics also show deterioration, with a five-year EBIT growth of -203.71%, raising questions about its sustainability and growth prospects.<BR><BR>In summary, while there are signs of improvement in the latest quarter, the overall results highlight significant challenges that could overshadow these gains. Investors should be cautious and consider the broader context of the company's performance.

View full answer

Should I buy, sell or hold Andhra Paper Ltd?

04-Aug-2026

When is the next results date for Andhra Paper Ltd?

06-May-2026

The next results date for Andhra Paper Ltd is 14 May 2026.

The next results date for Andhra Paper Ltd is scheduled for 14 May 2026.

View full answer

Is Andhra Paper technically bullish or bearish?

20-Nov-2025

As of November 19, 2025, Andhra Paper's technical trend is bearish, indicated by negative MACD readings, bearish Bollinger Bands, and underperformance against the Sensex.

As of 19 November 2025, the technical trend has changed from mildly bearish to bearish. The current stance for Andhra Paper is bearish with a strong indication of weakness. Key indicators driving this assessment include bearish readings on the MACD across both weekly and monthly time frames, as well as bearish signals from Bollinger Bands and KST. The daily moving averages also confirm a bearish outlook. While the Dow Theory shows a mildly bearish stance on a weekly and monthly basis, the overall technical picture remains negative, particularly given the significant underperformance compared to the Sensex over various periods.

View full answer

Is Andhra Paper overvalued or undervalued?

10-Nov-2025

As of November 7, 2025, Andhra Paper is considered overvalued and risky due to its high PE ratio of 71.06, negative EV to EBITDA of -47.78, and a low Price to Book Value of 0.08, especially when compared to peers like JK Paper and West Coast Paper, and it has underperformed the Sensex with a year-to-date return of -22.52%.

As of 7 November 2025, Andhra Paper's valuation grade has moved from expensive to risky, indicating a significant shift in its market perception. The company appears to be overvalued, particularly given its high PE ratio of 71.06 and negative EV to EBITDA of -47.78, which suggest that the stock price does not reflect the underlying financial health. Additionally, the Price to Book Value stands at a mere 0.08, further emphasizing the disconnect between market valuation and intrinsic value.<BR><BR>In comparison to its peers, Andhra Paper's valuation metrics are starkly higher than those of JK Paper, which has a PE ratio of 22.04, and West Coast Paper, with a PE of 11.81, both of which are categorized as fairly valued or attractive. This disparity highlights the overvaluation of Andhra Paper within its industry. Furthermore, the company's recent stock performance has underperformed against the Sensex, with a year-to-date return of -22.52% compared to the Sensex's 6.50%, reinforcing the notion that the stock may not be a sound investment at its current price of 73.44.

View full answer

How has been the historical performance of Andhra Paper?

09-Nov-2025

Andhra Paper has experienced significant financial declines, with net sales dropping from INR 2,097.66 crore in Mar'23 to INR 1,541.24 crore in Mar'25, and profit after tax decreasing from INR 522.46 crore to INR 88.91 crore. The company faces challenges in profitability and cost management, despite an increase in total assets and liabilities.

Answer:<BR>The historical performance of Andhra Paper shows significant fluctuations in key financial metrics over the years.<BR><BR>Breakdown:<BR>Andhra Paper's net sales have seen a decline from INR 2,097.66 crore in Mar'23 to INR 1,541.24 crore in Mar'25, reflecting a downward trend. Total operating income followed a similar pattern, decreasing from INR 2,097.66 crore in Mar'23 to INR 1,541.24 crore in Mar'25. The raw material cost increased from INR 821.18 crore in Mar'23 to INR 974.65 crore in Mar'25, contributing to the rise in total expenditure, which grew from INR 1,362.93 crore in Mar'23 to INR 1,406.68 crore in Mar'25. Consequently, operating profit (PBDIT) dropped from INR 786.75 crore in Mar'23 to INR 223.29 crore in Mar'25. Profit before tax also decreased significantly from INR 700.98 crore in Mar'23 to INR 117.07 crore in Mar'25, with profit after tax following suit from INR 522.46 crore to INR 88.91 crore over the same period. The company's total assets increased from INR 2,004.70 crore in Mar'23 to INR 2,604.63 crore in Mar'25, while total liabilities rose from INR 2,004.70 crore to INR 2,604.63 crore. Cash flow from operating activities turned negative at INR -55.00 crore in Mar'25, contrasting with positive cash flows in previous years. Overall, Andhra Paper's financial performance indicates challenges in maintaining profitability and managing costs amidst fluctuating revenues.

View full answer

Who are the top shareholders of the Andhra Paper?

17-Jul-2025

The top shareholders of Andhra Paper are West Coast Paper Mills Ltd, holding 72.45%, followed by mutual funds and the ICICI Prudential Smallcap Fund at 4.3%, with Foreign Institutional Investors owning 0.96% and individual investors collectively holding 14.0%.

The top shareholders of Andhra Paper include West Coast Paper Mills Ltd, which holds a significant 72.45% of the shares, making it the largest promoter. Additionally, mutual funds have a stake through one scheme, accounting for 4.3% of the holdings, with the ICICI Prudential Smallcap Fund being the highest public shareholder at the same percentage. Foreign Institutional Investors (FIIs) hold a smaller portion, with 0.96% held by 44 different FIIs. Individual investors collectively own about 14.0% of the company.

View full answer

Has Andhra Paper declared dividend?

06-Jun-2025

Yes, Andhra Paper Ltd has declared a 100% dividend, amounting to ₹10 per share, with an ex-date of August 5, 2024. Despite recent price declines, the dividend has positively impacted total returns over longer periods.

Andhra Paper Ltd has declared a 100% dividend.<BR><BR>Dividend Details:<BR>- Percentage announced: 100%<BR>- Amount per share: 10<BR>- Ex-date: 05 Aug 24<BR><BR>Dividend Yield: 2.61%.<BR><BR>Total Returns by Period:<BR>In the last 6 months, the price return was -26.19%, the dividend return was 0%, resulting in a total return of -26.19%.<BR><BR>Over the past year, the price return was -21.89%, the dividend return was 9.40%, leading to a total return of -12.49%.<BR><BR>In the 2-year period, the price return was -13.87%, the dividend return was 26.48%, resulting in a total return of 12.61%.<BR><BR>For the 3-year period, the price return was 11.71%, the dividend return was 52.26%, culminating in a total return of 63.97%.<BR><BR>In the last 4 years, the price return was 58.03%, the dividend return was 71.88%, leading to a total return of 129.91%.<BR><BR>Over the past 5 years, the price return was 49.97%, the dividend return was 73.93%, resulting in a total return of 123.9%.<BR><BR>Overall, Andhra Paper has declared a significant dividend, which has contributed positively to total returns over longer periods, despite recent declines in price returns in the shorter term.

View full answer
iScoreScore
Click here to find our call on this stock
Strong Sell
Sell
Hold
Buy
Strong Buy

Dashboard

1

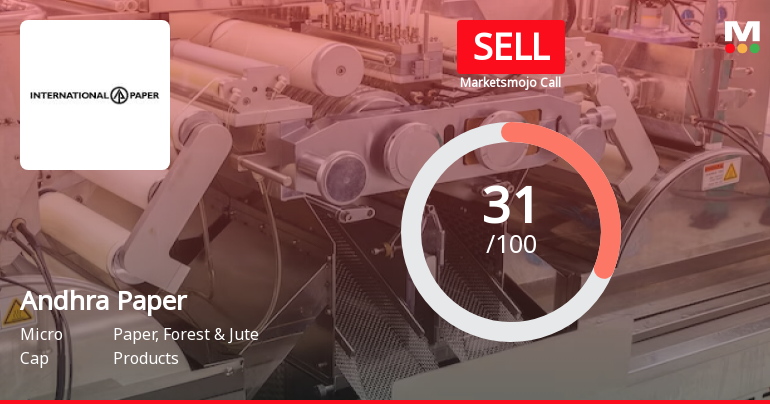
Poor long term growth as Operating profit has grown by an annual rate -190.12% of over the last 5 years

 
2

Risky - Negative Operating Profits

stock-summaryMojo Parameters

Mojo Parameters

Loading Valuation Snapshot...

Stock DNA

stock-summary
Industry

Paper, Forest & Jute Products

stock-summary
Market cap

INR 1,230 Cr (Micro Cap)

stock-summary
P/E

44.00

stock-summary
Industry P/E

15

stock-summary
Dividend Yield

0.82%

stock-summary
Debt Equity

-0.15

stock-summary
Return on Equity

1.42%

stock-summary
Price to Book

0.62

Revenue and Profits:
Net Sales:
394 Cr
(Quarterly Results - Jun 2026)
Net Profit:
30 Cr
stock-summaryTotal Returns
Total Returns (Price + Dividend) stock-summary
Dividend Yield (0.82%)
TimePeriod
Price Return
Dividend Return
Total Return
3 Months
-0.71%
0.82%
0.11%
6 Months
-7.57%
0.79%
-6.78%
1 Year
-21.58%
0.63%
-20.95%
2 Years
-45.56%
1.42%
-44.14%
3 Years
-31.78%
2.91%
-28.87%
4 Years
-36.84%
7.26%
-29.58%
5 Years
34.76%
16.37%
51.13%

Latest dividend: 0.5019376715646698 per share ex-dividend date: Aug-04-2026

Risk Adjusted Returns v/s stock-summary
Returns Beta
Icon
Beta has not been calculated since enough price history is not available
stock-summaryNews & Corporate Actions

Announcements stock-summary

International Paper APPM Limited - Change in Director(s)

01-Nov-2019 | Source : NSE

International Paper APPM Limited has informed the Exchange regarding Change in Director(s) of the company.

International Paper APPM Limited - Post Offer Public Announcement

16-Oct-2019 | Source : NSE

International Paper APPM Limitedost Offer Public Advertisement in Accordance with Regulation 18(12) of the Securities and Exchange Board of India ( Substantial Acquisition of Shares and Takeovers) Regulations, 2011, as Amended , for the attention of the Eligible Public Shareholders of International Paper APPM Limited.

Open Offer

12-Sep-2019 | Source : NSE

ICICI Securities Ltd has informed the Exchange regarding Open Offer for acquisition of up to 99,42,510 fully paid up equity shares of face value of INR 10 each ("Equity Shares") from the public Shareholders of International Paper APPM Limited ("Target Company") representing 25.00% (twenty five Percent) of the fully diluted voting Equity share capital of the target Company by West Coast Paper Mills Limited ("Acquirer") ("Offer") under the provision of the securities and Exchange Board of India (Substantial Acquisition of shares and takeovers) Regulations, 2011 and Subsequent amendments thereto ("SEBI (SAST) Regulations")

Corporate Actions stock-summary

stock-summary
BOARD MEETING

No Upcoming Board Meetings

stock-summary
DIVIDEND

Andhra Paper Ltd has declared 25% dividend, ex-date: 04 Aug 26

stock-summary
SPLITS

Andhra Paper Ltd has announced 2:10 stock split, ex-date: 11 Sep 24

stock-summary
BONUS

No Bonus history available

stock-summary
RIGHTS

Andhra Paper Ltd has announced 3:11 rights issue, ex-date: 23 Feb 10

stock-summaryKey Factors

Quality key factors stock-summary

Factor
Value
Sales Growth (5y)
10.69%
EBIT Growth (5y)
-190.12%
EBIT to Interest (avg)
36.51
Debt to EBITDA (avg)
0.86
Net Debt to Equity (avg)
-0.15
Sales to Capital Employed (avg)
1.00
Tax Ratio
24.80%
Dividend Payout Ratio
53.41%
Pledged Shares
0
Institutional Holding
5.76%
ROCE (avg)
26.43%
ROE (avg)
14.00%

Valuation key factors

Factor
Value
P/E Ratio
44
Industry P/E
15
Price to Book Value
0.62
EV to EBIT
-35.27
EV to EBITDA
11.08
EV to Capital Employed
0.56
EV to Sales
0.54
PEG Ratio
NA
Dividend Yield
0.82%
ROCE (Latest)
-1.46%
ROE (Latest)
1.42%

Technicals key factors

Indicator
Weekly
Monthly
MACD
Mildly Bullish
Bearish
RSI
No Signal
No Signal
Bollinger Bands
Bearish
Mildly Bearish
Moving Averages
Bearish (Daily)
KST
Bearish
Mildly Bullish
Dow Theory
No Trend
No Trend
OBV
Mildly Bearish
Mildly Bearish
stock-summary Technical Indicator Scale: Bearish, Mildly Bearish, Sideways, Mildly Bullish, Bullish  Turned 
stock-summaryShareholding
Shareholding Snapshot : Jun 2026stock-summary
Shareholding Compare (%holding) stock-summary
Majority shareholders

Promoters

Pledged Promoter Holdings

None

Mutual Funds

Held by 2 Schemes (5.11%)

FIIs

Held by 23 FIIs (0.27%)

Promoter with highest holding

None

Highest Public shareholder

Lok Prakashan Ltd (3.55%)

Individual Investors Holdings

13.77%

stock-summaryFinancial
[
  {
    "link": "quarterly",
    "btn_text": "All Quarterly Results",
    "header": "Quarterly Results Snapshot (Standalone) - Jun'26 - YoY",
    "rhs": [
      {
        "prefix": "Net Sales ",
        "suffix": "YoY Growth in quarter ended Jun 2026 is 0.09% vs 24.54% in Jun 2025",
        "dir": -1
      },
      {
        "prefix": "Standalone Net Profit ",
        "suffix": "YoY Growth in quarter ended Jun 2026 is 42.28% vs -23.01% in Jun 2025",
        "dir": 1
      }
    ],
    "table": {
      "header": [
        "Jun'26",
        "Jun'25",
        "Change(%)"
      ],
      "body": [
        {
          "field": "Net Sales",
          "val1": "393.77",
          "val2": "393.42",
          "chgp": "0.09%",
          "chgp_class": "positive"
        },
        {
          "field": "Operating Profit (PBDIT) excl Other Income",
          "val1": "48.78",
          "val2": "33.60",
          "chgp": "45.18%",
          "chgp_class": "positive"
        },
        {
          "field": "Interest",
          "val1": "2.90",
          "val2": "5.76",
          "chgp": "-49.65%",
          "chgp_class": "positive"
        },
        {
          "field": "Exceptional Items",
          "val1": "0.00",
          "val2": "0.00",
          "chgp": "",
          "chgp_class": "neutral"
        },
        {
          "field": "Standalone Net Profit",
          "val1": "30.32",
          "val2": "21.31",
          "chgp": "42.28%",
          "chgp_class": "positive"
        },
        {
          "field": "Operating Profit Margin (Excl OI)",
          "val1": "12.39%",
          "val2": "8.54%",
          "chgp": "3.85%",
          "chgp_class": "positive"
        }
      ]
    }
  },
  {
    "link": "half-yearly",
    "btn_text": "All Half Yearly Results",
    "header": "Half Yearly Results Snapshot (Standalone) - Sep'25",
    "rhs": [
      {
        "prefix": "Net Sales ",
        "suffix": " Growth in half year ended Sep 2025 is 0.98% vs -22.03% in Sep 2024",
        "dir": 1
      },
      {
        "prefix": "Standalone Net Profit ",
        "suffix": " Growth in half year ended Sep 2025 is -98.50% vs -68.29% in Sep 2024",
        "dir": -1
      }
    ],
    "table": {
      "header": [
        "Sep'25",
        "Sep'24",
        "Change(%)"
      ],
      "body": [
        {
          "field": "Net Sales",
          "val1": "755.50",
          "val2": "748.17",
          "chgp": "0.98%",
          "chgp_class": "positive"
        },
        {
          "field": "Operating Profit (PBDIT) excl Other Income",
          "val1": "26.79",
          "val2": "85.98",
          "chgp": "-68.84%",
          "chgp_class": "negative"
        },
        {
          "field": "Interest",
          "val1": "9.96",
          "val2": "6.11",
          "chgp": "63.01%",
          "chgp_class": "negative"
        },
        {
          "field": "Exceptional Items",
          "val1": "0.00",
          "val2": "0.00",
          "chgp": "",
          "chgp_class": "neutral"
        },
        {
          "field": "Standalone Net Profit",
          "val1": "1.04",
          "val2": "69.41",
          "chgp": "-98.50%",
          "chgp_class": "negative"
        },
        {
          "field": "Operating Profit Margin (Excl OI)",
          "val1": "3.55%",
          "val2": "11.49%",
          "chgp": "-7.94%",
          "chgp_class": "negative"
        }
      ]
    }
  },
  {
    "link": "nine-monthly",
    "btn_text": "All Nine Monthly Results",
    "header": "Nine Monthly Results Snapshot (Standalone) - Dec'25",
    "rhs": [
      {
        "prefix": "Net Sales ",
        "suffix": "YoY Growth in nine months ended Dec 2025 is 3.56% vs -21.05% in Dec 2024",
        "dir": 1
      },
      {
        "prefix": "Standalone Net Profit ",
        "suffix": "YoY Growth in nine months ended Dec 2025 is -86.57% vs -73.10% in Dec 2024",
        "dir": -1
      }
    ],
    "table": {
      "header": [
        "Dec'25",
        "Dec'24",
        "Change(%)"
      ],
      "body": [
        {
          "field": "Net Sales",
          "val1": "1,174.19",
          "val2": "1,133.87",
          "chgp": "3.56%",
          "chgp_class": "positive"
        },
        {
          "field": "Operating Profit (PBDIT) excl Other Income",
          "val1": "42.19",
          "val2": "114.29",
          "chgp": "-63.09%",
          "chgp_class": "negative"
        },
        {
          "field": "Interest",
          "val1": "14.51",
          "val2": "10.64",
          "chgp": "36.37%",
          "chgp_class": "negative"
        },
        {
          "field": "Exceptional Items",
          "val1": "0.00",
          "val2": "0.00",
          "chgp": "",
          "chgp_class": "neutral"
        },
        {
          "field": "Standalone Net Profit",
          "val1": "10.89",
          "val2": "81.06",
          "chgp": "-86.57%",
          "chgp_class": "negative"
        },
        {
          "field": "Operating Profit Margin (Excl OI)",
          "val1": "3.59%",
          "val2": "10.08%",
          "chgp": "-6.49%",
          "chgp_class": "negative"
        }
      ]
    }
  },
  {
    "link": "annual",
    "btn_text": "All Annual Results",
    "header": "Annual Results Snapshot (Standalone) - Mar'26",
    "rhs": [
      {
        "prefix": "Net Sales ",
        "suffix": "YoY Growth in year ended Mar 2026 is 10.38% vs -14.40% in Mar 2025",
        "dir": 1
      },
      {
        "prefix": "Standalone Net Profit ",
        "suffix": "YoY Growth in year ended Mar 2026 is -79.06% vs -73.83% in Mar 2025",
        "dir": -1
      }
    ],
    "table": {
      "header": [
        "Mar'26",
        "Mar'25",
        "Change(%)"
      ],
      "body": [
        {
          "field": "Net Sales",
          "val1": "1,701.23",
          "val2": "1,541.24",
          "chgp": "10.38%",
          "chgp_class": "positive"
        },
        {
          "field": "Operating Profit (PBDIT) excl Other Income",
          "val1": "67.30",
          "val2": "134.56",
          "chgp": "-49.99%",
          "chgp_class": "negative"
        },
        {
          "field": "Interest",
          "val1": "18.22",
          "val2": "17.89",
          "chgp": "1.84%",
          "chgp_class": "negative"
        },
        {
          "field": "Exceptional Items",
          "val1": "0.00",
          "val2": "0.00",
          "chgp": "",
          "chgp_class": "neutral"
        },
        {
          "field": "Standalone Net Profit",
          "val1": "18.62",
          "val2": "88.91",
          "chgp": "-79.06%",
          "chgp_class": "negative"
        },
        {
          "field": "Operating Profit Margin (Excl OI)",
          "val1": "3.96%",
          "val2": "8.73%",
          "chgp": "-4.77%",
          "chgp_class": "negative"
        }
      ]
    }
  }
]

Quarterly Results Snapshot (Standalone) - Jun'26 - YoYstock-summary

Jun'26
Jun'25
Change(%)
Net Sales
393.77
393.42
0.09%
Operating Profit (PBDIT) excl Other Income
48.78
33.60
45.18%
Interest
2.90
5.76
-49.65%
Exceptional Items
0.00
0.00
Standalone Net Profit
30.32
21.31
42.28%
Operating Profit Margin (Excl OI)
12.39%
8.54%
3.85%
Values in Rs Cr.
Direction Arrows
Net Sales

YoY Growth in quarter ended Jun 2026 is 0.09% vs 24.54% in Jun 2025

Direction Arrows
Standalone Net Profit

YoY Growth in quarter ended Jun 2026 is 42.28% vs -23.01% in Jun 2025

Half Yearly Results Snapshot (Standalone) - Sep'25stock-summary

Sep'25
Sep'24
Change(%)
Net Sales
755.50
748.17
0.98%
Operating Profit (PBDIT) excl Other Income
26.79
85.98
-68.84%
Interest
9.96
6.11
63.01%
Exceptional Items
0.00
0.00
Standalone Net Profit
1.04
69.41
-98.50%
Operating Profit Margin (Excl OI)
3.55%
11.49%
-7.94%
Values in Rs Cr.
Direction Arrows
Net Sales

Growth in half year ended Sep 2025 is 0.98% vs -22.03% in Sep 2024

Direction Arrows
Standalone Net Profit

Growth in half year ended Sep 2025 is -98.50% vs -68.29% in Sep 2024

Nine Monthly Results Snapshot (Standalone) - Dec'25stock-summary

Dec'25
Dec'24
Change(%)
Net Sales
1,174.19
1,133.87
3.56%
Operating Profit (PBDIT) excl Other Income
42.19
114.29
-63.09%
Interest
14.51
10.64
36.37%
Exceptional Items
0.00
0.00
Standalone Net Profit
10.89
81.06
-86.57%
Operating Profit Margin (Excl OI)
3.59%
10.08%
-6.49%
Values in Rs Cr.
Direction Arrows
Net Sales

YoY Growth in nine months ended Dec 2025 is 3.56% vs -21.05% in Dec 2024

Direction Arrows
Standalone Net Profit

YoY Growth in nine months ended Dec 2025 is -86.57% vs -73.10% in Dec 2024

Annual Results Snapshot (Standalone) - Mar'26stock-summary

Mar'26
Mar'25
Change(%)
Net Sales
1,701.23
1,541.24
10.38%
Operating Profit (PBDIT) excl Other Income
67.30
134.56
-49.99%
Interest
18.22
17.89
1.84%
Exceptional Items
0.00
0.00
Standalone Net Profit
18.62
88.91
-79.06%
Operating Profit Margin (Excl OI)
3.96%
8.73%
-4.77%
Values in Rs Cr.
Direction Arrows
Net Sales

YoY Growth in year ended Mar 2026 is 10.38% vs -14.40% in Mar 2025

Direction Arrows
Standalone Net Profit

YoY Growth in year ended Mar 2026 is -79.06% vs -73.83% in Mar 2025

stock-summaryCompany CV
About Andhra Paper Ltd stock-summary
stock-summary
Andhra Paper Ltd
Micro Cap
Paper, Forest & Jute Products
Andhra Paper Ltd (Formerly known as International Paper APPM Ltd), currently a L N Bangur Group Company was originally set up by a private entrepreneur and changed hands twice in the pre-independence period because of losses. Later in 1953, the company was taken over by the Indian Government. Pursuant to an agreement between the Government of Andhra Pradesh and G D Somani, an Industrialist, the Andhra Pradesh Paper Mills, as we know it today, came into existence.
Company Coordinates stock-summary
Company Details
East Godavari District , Rajahmundry Andhra Pradesh : 533105
stock-summary
Tel: 91-883-2471831-2471834
stock-summary
prabhakar.cherukumudi@ipaper.com
Registrar Details
Karvy Computershare Pvt Ltd, Plot No 17-24 , Near Image Hospital,, Reliance Cybervilae,Vithalrao Nagar,, Madhapur, Hyderabad