
Compare Andhra Paper with Similar Stocks
Stock DNA
Paper, Forest & Jute Products
INR 1,269 Cr (Micro Cap)
68.00
17
1.55%
-0.20
0.97%
0.66
Total Returns (Price + Dividend) 
Latest dividend: 0.9966921119592876 per share ex-dividend date: Aug-01-2025
Risk Adjusted Returns v/s
Returns Beta

News

Andhra Paper Ltd is Rated Sell
Andhra Paper Ltd is rated 'Sell' by MarketsMOJO, with this rating last updated on 15 May 2026. However, the analysis and financial metrics discussed here reflect the stock's current position as of 17 June 2026, providing investors with an up-to-date view of the company’s performance and outlook.
Read full news article
Andhra Paper Ltd is Rated Sell by MarketsMOJO
Andhra Paper Ltd is rated 'Sell' by MarketsMOJO, with this rating last updated on 15 May 2026. However, the analysis and financial metrics discussed here reflect the stock's current position as of 08 June 2026, providing investors with an up-to-date view of the company’s fundamentals, returns, and market standing.
Read full news article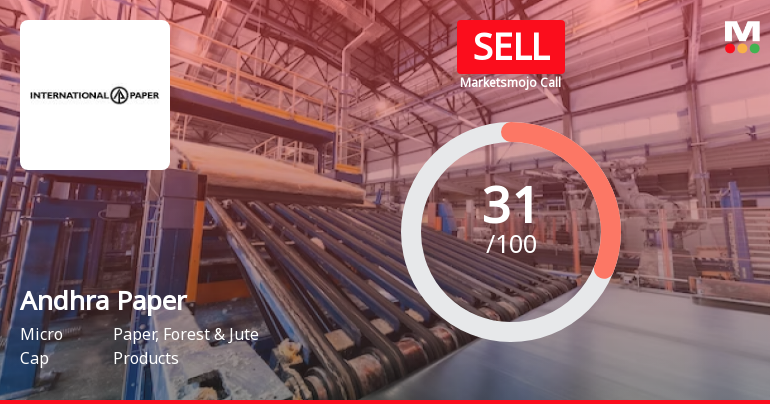
Andhra Paper Ltd is Rated Sell
Andhra Paper Ltd is rated 'Sell' by MarketsMOJO, with this rating last updated on 15 May 2026. However, the analysis and financial metrics discussed here reflect the stock's current position as of 08 June 2026, providing investors with the latest insights into the company’s performance and outlook.
Read full news article Announcements
International Paper APPM Limited - Change in Director(s)
01-Nov-2019 | Source : NSEInternational Paper APPM Limited has informed the Exchange regarding Change in Director(s) of the company.
International Paper APPM Limited - Post Offer Public Announcement
16-Oct-2019 | Source : NSEInternational Paper APPM Limitedost Offer Public Advertisement in Accordance with Regulation 18(12) of the Securities and Exchange Board of India ( Substantial Acquisition of Shares and Takeovers) Regulations, 2011, as Amended , for the attention of the Eligible Public Shareholders of International Paper APPM Limited.
Open Offer
12-Sep-2019 | Source : NSE
| ICICI Securities Ltd has informed the Exchange regarding Open Offer for acquisition of up to 99,42,510 fully paid up equity shares of face value of INR 10 each ("Equity Shares") from the public Shareholders of International Paper APPM Limited ("Target Company") representing 25.00% (twenty five Percent) of the fully diluted voting Equity share capital of the target Company by West Coast Paper Mills Limited ("Acquirer") ("Offer") under the provision of the securities and Exchange Board of India (Substantial Acquisition of shares and takeovers) Regulations, 2011 and Subsequent amendments thereto ("SEBI (SAST) Regulations") |
Corporate Actions

No Upcoming Board Meetings

Andhra Paper Ltd has declared 50% dividend, ex-date: 01 Aug 25

Andhra Paper Ltd has announced 2:10 stock split, ex-date: 11 Sep 24

No Bonus history available

Andhra Paper Ltd has announced 3:11 rights issue, ex-date: 23 Feb 10
Quality key factors
Valuation key factors
Technicals key factors
 Technical Indicator Scale: Bearish, Mildly Bearish, Sideways, Mildly Bullish, Bullish Turned
 Shareholding Snapshot : Mar 2026
Shareholding Compare (%holding)
Promoters
None
Held by 2 Schemes (5.41%)
Held by 25 FIIs (0.34%)
West Coast Paper Mills Ltd (72.45%)
Icici Prudential Smallcap Fund (3.6%)
13.51%
Quarterly Results Snapshot (Standalone) - Mar'26 - YoY

YoY Growth in quarter ended Mar 2026 is 29.38% vs 11.80% in Mar 2025
YoY Growth in quarter ended Mar 2026 is -1.66% vs -79.56% in Mar 2025
Half Yearly Results Snapshot (Standalone) - Sep'25
Growth in half year ended Sep 2025 is 0.98% vs -22.03% in Sep 2024

Growth in half year ended Sep 2025 is -98.50% vs -68.29% in Sep 2024
Nine Monthly Results Snapshot (Standalone) - Dec'25
YoY Growth in nine months ended Dec 2025 is 3.56% vs -21.05% in Dec 2024
YoY Growth in nine months ended Dec 2025 is -86.57% vs -73.10% in Dec 2024
Annual Results Snapshot (Standalone) - Mar'25
YoY Growth in year ended Mar 2025 is -14.40% vs -14.16% in Mar 2024
YoY Growth in year ended Mar 2025 is -73.83% vs -34.97% in Mar 2024
About Andhra Paper Ltd

Company Coordinates


