
Compare Filatex Fash. with Similar Stocks
Dashboard
Weak Long Term Fundamental Strength with a -57.85% CAGR growth in Operating Profits over the last 5 years
- The company has been able to generate a Return on Equity (avg) of 0.37% signifying low profitability per unit of shareholders funds
With a fall in Net Sales of -6.44%, the company declared Very Negative results in Dec 25
Reducing Promoter Confidence
Stock DNA
Garments & Apparels
INR 133 Cr (Micro Cap)
31.00
20
0.00%
0.02
0.34%
0.05
Total Returns (Price + Dividend) 
Latest dividend: 0 per share ex-dividend date: Sep-22-2021
Risk Adjusted Returns v/s
Returns Beta

News
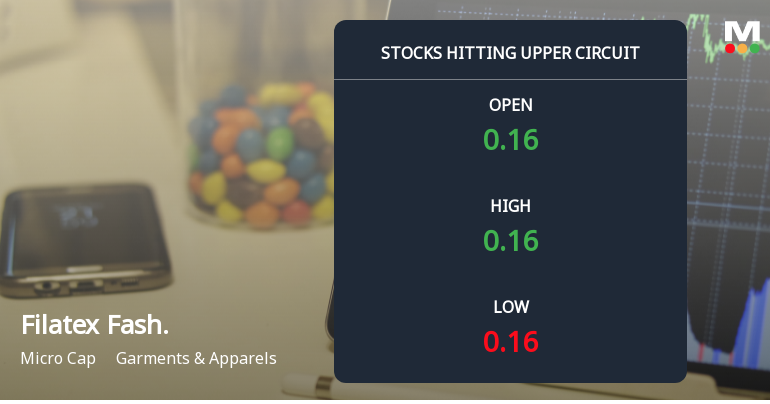
Filatex Fashions Ltd Locks at Upper Circuit With 6.67% Gain — Buyers Queue, Sellers Absent
At Rs 0.16, the buying was done — not because demand dried up, but because the exchange wouldn't let the stock go any higher. Filatex Fashions Ltd locked at its upper circuit of 6.67% on 2 Apr 2026, with buyers queuing and no sellers willing to part with shares.
Read full news article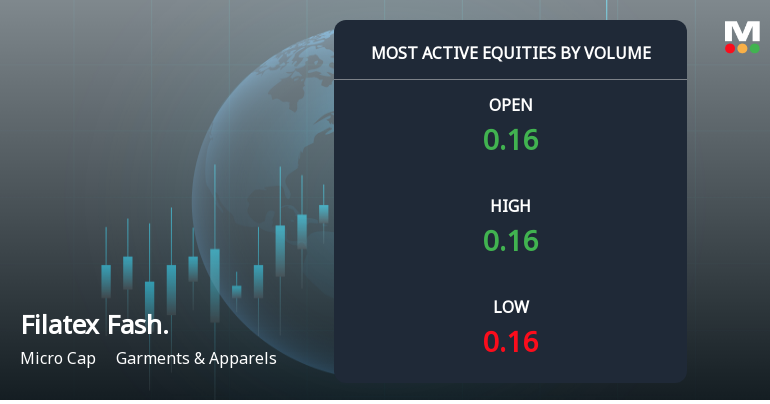
Filatex Fashions Ltd Sees Exceptional Volume Surge Amid Sector Weakness
Filatex Fashions Ltd (FILATFASH), a micro-cap player in the Garments & Apparels sector, witnessed a remarkable surge in trading volume on 2 April 2026, standing out as one of the most actively traded stocks by volume. Despite a broader sector decline and subdued market conditions, the stock outperformed its peers with a 6.67% gain, driven by heightened investor interest and notable accumulation signals.
Read full news article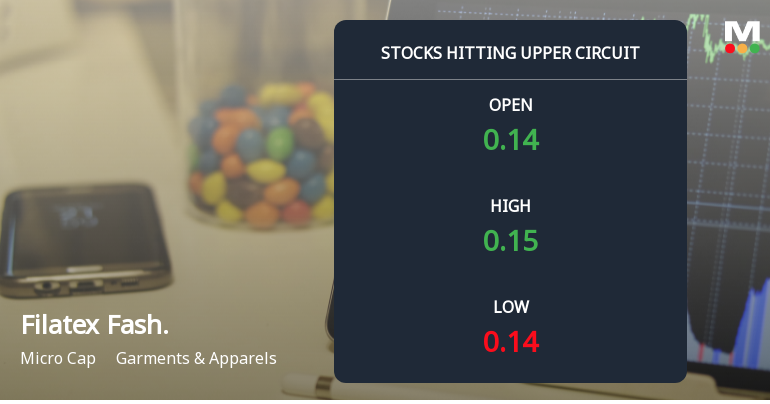
Filatex Fashions Ltd Locks at Upper Circuit With 7.14% Gain — Buyers Queue, Sellers Absent
At Rs 0.15, the buying was done — not because demand dried up, but because the exchange wouldn't let the stock go any higher. Filatex Fashions Ltd locked at its upper circuit of 7.14% on 1 Apr 2026, with buyers queuing and no sellers willing to part with shares.
Read full news article Announcements
Corporate Actions

No Upcoming Board Meetings


Filatex Fashions Ltd has announced 1:5 stock split, ex-date: 09 Aug 24

No Bonus history available

No Rights history available
Quality key factors
Valuation key factors
Technicals key factors
 Technical Indicator Scale: Bearish, Mildly Bearish, Sideways, Mildly Bullish, Bullish Turned
 Shareholding Snapshot : Dec 2025
Shareholding Compare (%holding)
Non Institution
None
Held by 0 Schemes
Held by 2 FIIs (0.52%)
Prabhat Sethia (19.03%)
Ramaswamyreddy Pedinekaluva . (3.92%)
69.63%
Quarterly Results Snapshot (Consolidated) - Dec'25 - QoQ

QoQ Growth in quarter ended Dec 2025 is -6.44% vs -48.29% in Sep 2025

QoQ Growth in quarter ended Dec 2025 is -95.19% vs -27.27% in Sep 2025
Half Yearly Results Snapshot (Consolidated) - Sep'25
Growth in half year ended Sep 2025 is 10.03% vs -1.80% in Sep 2024
Growth in half year ended Sep 2025 is -37.63% vs 16.47% in Sep 2024
Nine Monthly Results Snapshot (Consolidated) - Dec'25
YoY Growth in nine months ended Dec 2025 is -22.25% vs 8.72% in Dec 2024
YoY Growth in nine months ended Dec 2025 is -67.27% vs 23.60% in Dec 2024
Annual Results Snapshot (Consolidated) - Mar'25
YoY Growth in year ended Mar 2025 is 5.33% vs 7.49% in Mar 2024
YoY Growth in year ended Mar 2025 is -21.30% vs 0.50% in Mar 2024
About Filatex Fashions Ltd

Company Coordinates


