NTPC

INR
330.85
0.85 (0.26%)
BSENSE

Sep 03, 09:38 AM

BSE+NSE Vol: 7.92 lacs

  • Price Points
  • Score
  • Mojo Parameters
  • Total Return
  • News and Corporate Actions
  • Key factors
  • Shareholding
  • Financials
  • CompanyCV
stock-summaryPrice Point
High/Low

1Day

52 Week

Valuation
Technical
Day's Volume

CASH

7.92 lacs (-4.51%) Volume

Shareholding (Jun 2026)

FII

16.30%

Held by 702 FIIs

DII

29.45%

Held by 502 DIIs

Promoter

51.10%

Why is NTPC Ltd. falling/rising?

03-Sep-2026

As of 02-Sep, NTPC Ltd. is seeing a stock price increase to 330.15, indicating a potential trend reversal after recent declines. However, it remains below key moving averages and close to its 52-week low, with decreased investor participation, despite strong long-term growth potential and positive financial results.

As of 02-Sep, NTPC Ltd. is experiencing a rise in its stock price, currently at 330.15, reflecting an increase of 3.15 (0.96%). This upward movement comes after two consecutive days of decline, indicating a potential trend reversal. Despite this recent gain, the stock has underperformed compared to its sector by 0.37% today and is trading below its 5-day, 20-day, 50-day, 100-day, and 200-day moving averages, which suggests a generally weaker performance over the short to medium term.<BR><BR>The stock is also close to its 52-week low, being only 4.42% away from the low of Rs 315.55. Additionally, there has been a notable decrease in investor participation, with delivery volume falling by 18.26% against the 5-day average. However, the company shows healthy long-term growth potential, with net sales growing at an annual rate of 10.64% and a high dividend yield of 3.7%, which may attract some investors despite the current volatility.<BR><BR>Moreover, NTPC Ltd. has reported positive financial results, including a significant growth in profit after tax (PAT) and operating profit, which could contribute to investor confidence. The company also has a high institutional holding of 45.74%, suggesting that more knowledgeable investors are backing the stock. Overall, while NTPC Ltd. is currently rising, it faces challenges such as low management efficiency and high debt levels, which may affect its future performance.

View full answer

Who are in the management team of NTPC?

01-Sep-2026

The management team of NTPC includes Gurdeep Singh (Chairman, Managing Director & CEO), Dilip Kumar Patel, Ramesh Babu V, Ujjwal Kanti Bhattacharya (Whole Time Directors), along with several independent directors and nominees, overseeing the company's operations and strategic direction.

The management team of NTPC includes the following key members:<BR><BR>1. **Gurdeep Singh** - Chairman, Managing Director & CEO<BR>2. **Dilip Kumar Patel** - Whole Time Director<BR>3. **Ramesh Babu V** - Whole Time Director<BR>4. **Ujjwal Kanti Bhattacharya** - Whole Time Director<BR>5. **Ashish Upadhyaya** - Nominee<BR>6. **Sangitha Varier** - Independent Director<BR>7. **Jitendra Jayantilal Tanna** - Independent Director<BR>8. **Vidyadhar Vaishampayan** - Independent Director<BR>9. **Vivek Gupta** - Independent Director<BR>10. **Jaikumar Srinivasan** - Director (Finance)<BR>11. **Piyush Singh** - Nominee<BR>12. **Shivam Srivastav** - Director<BR><BR>This team is responsible for overseeing the operations and strategic direction of NTPC.

View full answer

What does NTPC do?

01-Sep-2026

NTPC Limited is India's largest power utility company, generating and selling bulk power to State Power Utilities. As of June 2026, it reported net sales of ₹50,741 Cr and a net profit of ₹6,721 Cr, with a market cap of ₹318,778 Cr.

Overview: <BR>NTPC Limited is India's largest power utility company engaged in the generation and sale of bulk power to State Power Utilities, operating in the power industry with a large-cap market classification.<BR><BR>History: <BR>NTPC was incorporated in 1975 and has maintained its status as a leading power utility provider. The latest quarterly results reported are for June 2026, showcasing significant sales and profit figures.<BR><BR>Financial Snapshot: <BR>Most recent Net Sales: 50,741 Cr (Quarterly Results - Jun 2026) <BR>Most recent Net Profit: 6,721 Cr (Quarterly Results - Jun 2026) <BR>Market-cap value: INR 318,778 Cr (Large Cap)<BR><BR>Key Metrics: <BR>P/E: 11.00 <BR>Industry P/E: 22 <BR>Dividend Yield: 2.62% <BR>Debt-Equity: 1.29 <BR>Return on Equity: 13.31% <BR>Price-to-Book: 1.58 <BR><BR>Contact Details: <BR>Address: NTPC Bhawan SCOPE Complex, 7 Institutional Area Lodi Road New Delhi New Delhi : 110003 <BR>Tel: 91-11-24360100/7072 <BR>Email: csntpc@ntpc.co.in <BR>Website: http://www.ntpc.co.in

View full answer

Who are the peers of the NTPC?

01-Sep-2026

NTPC's peers include Adani Power, Power Grid Corp, Tata Power, and NHPC Ltd, among others. In terms of management risk, Torrent Power shows excellent management, while NTPC has below-average risk and a low 1-year return of 0.05%, outperforming only NHPC Ltd.

Peers: The peers of NTPC are Adani Power, Power Grid Corpn, Adani Green, Adani Energy Sol, Tata Power Co., JSW Energy, NTPC Green Ene., NHPC Ltd, Torrent Power, and NLC India.<BR><BR>Quality Snapshot: Excellent management risk is observed at Torrent Power, while Good management risk is found at Power Grid Corpn. Average management risk is present at Adani Power and Tata Power Co., while Below Average management risk is noted at Adani Green, Adani Energy Sol, JSW Energy, NTPC Green Ene., and NHPC Ltd, and the rest. Growth is Excellent for Adani Green, Adani Energy Sol, JSW Energy, and NTPC Green Ene., Good for NTPC and Tata Power Co., and Below Average for Power Grid Corpn and NHPC Ltd, and the rest. Capital Structure is Average at Torrent Power, Below Average at Adani Power, Power Grid Corpn, Adani Green, Adani Energy Sol, Tata Power Co., JSW Energy, NTPC Green Ene., NHPC Ltd, and NLC India.<BR><BR>Return Snapshot: Adani Energy Sol has the highest 1-year return at 91.57%, while NTPC has the lowest at 0.05%. NTPC's 1-year return is lower than that of all its peers except NHPC Ltd, which has a return of -2.96%. Additionally, the six-month return is negative for Adani Power, NTPC, Power Grid Corpn, Tata Power Co., JSW Energy, NTPC Green Ene., and Torrent Power.

View full answer

How big is NTPC?

01-Sep-2026

As of 31st August, NTPC Ltd. has a market capitalization of 318,778.00 Cr and reported net sales of 191058.77 Cr and net profit of 27762.97 Cr over the latest four quarters.

As of 31st August, <BR><BR>Market Cap: NTPC Ltd. has a market capitalization of 318,778.00 Cr, classified as a Large Cap company.<BR><BR>Recent Quarterly Performance: The sum of Net Sales for the latest 4 quarters is 191058.77 Cr, while the sum of Net Profit for the same period is 27762.97 Cr.<BR><BR>Balance Sheet Snapshot: The reporting period for the latest annual data is March 2026. Shareholder's Funds amount to 2,03,175.67 Cr, and Total Assets are valued at 5,58,054.04 Cr.

View full answer

Should I buy, sell or hold NTPC Ltd.?

12-Aug-2026

Are NTPC Ltd. latest results good or bad?

25-Jul-2026

NTPC Ltd.'s latest results show an 11.82% year-over-year profit growth and improved sales, but a significant 35.91% decline in profit from the previous quarter raises concerns about sustainability. Overall, while revenue and margins are strong, the stock's underperformance relative to peers suggests caution for investors.

NTPC Ltd.'s latest results present a mixed picture. On the positive side, the company reported a consolidated net profit of ₹6,721.05 crores for Q1 FY27, reflecting an 11.82% year-over-year growth. Additionally, net sales reached ₹50,740.96 crores, marking a 7.81% increase compared to the same quarter last year. The operating margin also improved to 31.99%, which is the highest in recent quarters, indicating better operational efficiency.<BR><BR>However, there are significant concerns as well. The net profit saw a sharp decline of 35.91% compared to the previous quarter, primarily due to an inflated profit figure in Q4 FY26 caused by a negative tax charge. This decline raises questions about the sustainability of profit levels moving forward. Furthermore, NTPC's stock has underperformed the broader power sector by 13.40 percentage points over the past year, which may indicate investor caution regarding the company's growth prospects.<BR><BR>In summary, while NTPC has shown robust revenue growth and improved margins, the volatility in profit and underperformance relative to peers suggest that investors should approach the stock with caution.

View full answer

When is the next results date for NTPC Ltd.?

18-May-2026

The next results date for NTPC Ltd. is 23 May 2026.

The next results date for NTPC Ltd. is scheduled for 23 May 2026.

View full answer

How has been the historical performance of NTPC?

12-Nov-2025

NTPC has demonstrated strong historical performance, with net sales growing from ₹1,00,286.54 crore in Mar'19 to ₹1,88,138.06 crore in Mar'25, alongside significant increases in operating profit, profit before tax, and earnings per share. Total assets rose from ₹3,77,387.13 crore in Mar'20 to ₹5,23,220.26 crore in Mar'25, reflecting the company's expanding operations.

Answer:<BR>The historical performance of NTPC shows a consistent growth trend in net sales, with figures increasing from 1,00,286.54 crore in Mar'19 to 1,88,138.06 crore in Mar'25. Total operating income has followed a similar trajectory, rising from 1,00,286.54 crore in Mar'19 to 1,88,138.06 crore in Mar'25. Operating profit (PBDIT) has also seen a steady increase, reaching 56,851.96 crore in Mar'25, up from 28,927.38 crore in Mar'19. Profit before tax has improved from 14,653.70 crore in Mar'19 to 26,282.70 crore in Mar'25, while profit after tax peaked at 18,037.52 crore in Mar'25, showing a robust growth from 17,433.64 crore in Mar'19. The company's earnings per share (EPS) have increased from 13.88 in Mar'19 to 24.16 in Mar'25, reflecting strong profitability. On the balance sheet, total assets have expanded significantly from 3,77,387.13 crore in Mar'20 to 5,23,220.26 crore in Mar'25, while total liabilities have also risen, indicating a growing scale of operations.<BR><BR>Breakdown:<BR>NTPC's financial performance over the years illustrates a strong upward trend in key metrics. Net sales have surged from 1,00,286.54 crore in Mar'19 to 1,88,138.06 crore in Mar'25, indicating robust revenue growth. The total operating income mirrors this growth, reaching 1,88,138.06 crore in Mar'25. Operating profit (PBDIT) has increased significantly, from 28,927.38 crore in Mar'19 to 56,851.96 crore in Mar'25, showcasing improved operational efficiency. Profit before tax has also risen from 14,653.70 crore in Mar'19 to 26,282.70 crore in Mar'25, while profit after tax has grown to 18,037.52 crore in Mar'25 from 17,433.64 crore in Mar'19. The EPS has seen a notable increase, reflecting enhanced profitability. On the balance sheet, total assets have expanded from 3,77,387.13 crore in Mar'20 to 5,23,220.26 crore in Mar'25, with total liabilities increasing correspondingly, indicating a scaling up of operations.

View full answer

Is NTPC overvalued or undervalued?

11-Nov-2025

As of November 10, 2025, NTPC is considered overvalued with a PE ratio of 13.30 and a 1-year return of -18.09%, despite being relatively more attractive than peers like Adani Power and Power Grid Corporation, which are categorized as very expensive.

As of 10 November 2025, NTPC's valuation grade has moved from fair to expensive, indicating a shift towards overvaluation. The company is currently assessed as overvalued based on key financial metrics, including a PE ratio of 13.30, an EV to EBITDA ratio of 10.30, and a PEG ratio of 1.75. <BR><BR>In comparison to its peers, NTPC's valuation stands out, as Adani Power and Power Grid Corporation are both categorized as very expensive with PE ratios of 24.05 and 16.42, respectively. This suggests that while NTPC is relatively more attractive than some peers, it still does not warrant the current price level given its performance metrics. Additionally, NTPC's recent stock performance has lagged behind the Sensex, with a 1-year return of -18.09% compared to the Sensex's 5.09%, reinforcing the notion that the stock may be overvalued at this time.

View full answer

Is NTPC technically bullish or bearish?

11-Nov-2025

As of November 10, 2025, NTPC's technical trend is neutral with mixed indicators, showing a shift from mildly bullish to sideways, characterized by bearish MACD and Bollinger Bands, and weak overall strength with no clear direction.

As of 10 November 2025, the technical trend for NTPC has changed from mildly bullish to sideways. The current technical stance is neutral, with mixed indicators influencing this view. The weekly MACD is bearish, while the monthly MACD is mildly bearish, indicating a lack of upward momentum. The Bollinger Bands are bearish on both weekly and monthly time frames, further supporting a cautious outlook. The daily moving averages are mildly bullish, but this is offset by the weekly KST being bullish and the monthly KST being mildly bearish. The Dow Theory shows no trend on the weekly and mildly bearish on the monthly, suggesting uncertainty in the longer-term direction. Overall, the strength of the current stance is weak, with no clear bullish or bearish signal dominating the analysis.

View full answer

Who are the top shareholders of the NTPC?

17-Jul-2025

The top shareholders of NTPC include the President of India with 51.1%, mutual funds with 17.54%, foreign institutional investors with 17.79%, and individual investors holding 2.96%. The largest public shareholder is ICICI Prudential Equity & Debt Fund at 4.22%.

The top shareholders of NTPC include the President of India, who holds a significant 51.1% stake as the major promoter. Additionally, mutual funds collectively hold 17.54% of the shares through 40 different schemes, while foreign institutional investors (FIIs) own 17.79% through 675 different entities. The highest public shareholder is ICICI Prudential Equity & Debt Fund, which holds 4.22%. Individual investors account for 2.96% of the shareholding.

View full answer

What is the bonus history of the NTPC?

06-Jun-2025

NTPC Ltd. issued a bonus of 1:5 on March 19, 2019, granting one additional share for every five shares held. The record date for this bonus was March 20, 2019.

NTPC Ltd. has a bonus history that includes a significant issue announced on March 19, 2019. The company issued a bonus in a ratio of 1:5, meaning that for every five shares held, shareholders received one additional share. The record date for this bonus was March 20, 2019, and the ex-date was March 19, 2019. This was the latest bonus action recorded for NTPC.

View full answer

Has NTPC declared dividend?

06-Jun-2025

Yes, NTPC Ltd. has declared a 25% dividend, amounting to ₹2.5 per share, with an ex-date of January 31, 2025. Despite recent short-term declines, the company has shown significant total returns over longer periods, with a total return of 273.36% over the past 5 years.

NTPC Ltd. has declared a 25% dividend.<BR><BR>Dividend Details:<BR>- Percentage announced: 25%<BR>- Amount per share: 2.5<BR>- Ex-date: 31 Jan 25<BR><BR>Dividend Yield: 1.73%.<BR><BR>Total Returns by Period:<BR>In the last 6 months, NTPC experienced a price return of -10.34%, a dividend return of 0.68%, resulting in a total return of -9.66%.<BR><BR>Over the past year, the company saw a price return of -5.36%, a dividend return of 1.55%, leading to a total return of -3.81%.<BR><BR>In the 2-year period, NTPC reported a price return of 88.96%, with a dividend return of 7.05%, culminating in a total return of 96.01%.<BR><BR>For the 3-year period, the price return was 113.5%, the dividend return was 14.75%, resulting in a total return of 128.25%.<BR><BR>In the last 4 years, NTPC achieved a price return of 196.16%, a dividend return of 23.59%, which gave a total return of 219.75%.<BR><BR>Finally, over the past 5 years, the company experienced a price return of 238.01%, with a dividend return of 35.35%, leading to a total return of 273.36%.<BR><BR>Overall, NTPC's dividend declaration indicates a commitment to returning value to shareholders, while the total returns over various periods show significant growth, particularly in the longer term, despite some recent short-term declines.

View full answer
iScoreScore
Click here to find our call on this stock
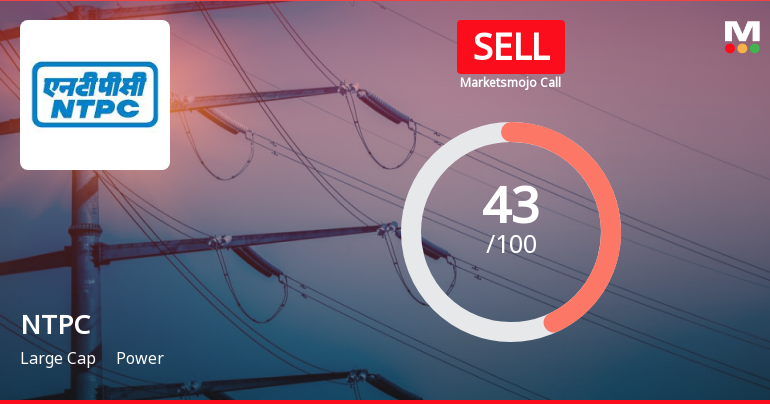
Strong Sell
Sell
Hold
Buy
Strong Buy

Dashboard

1

Poor Management Efficiency with a low ROCE of 8.41%

  • The company has been able to generate a Return on Capital Employed (avg) of 8.41% signifying low profitability per unit of total capital (equity and debt)
2

Low ability to service debt as the company has a high Debt to EBITDA ratio of 4.90 times

stock-summaryMojo Parameters

Mojo Parameters

Loading Valuation Snapshot...

Stock DNA

stock-summary
Industry

Power

stock-summary
Market cap

INR 320,814 Cr (Large Cap)

stock-summary
P/E

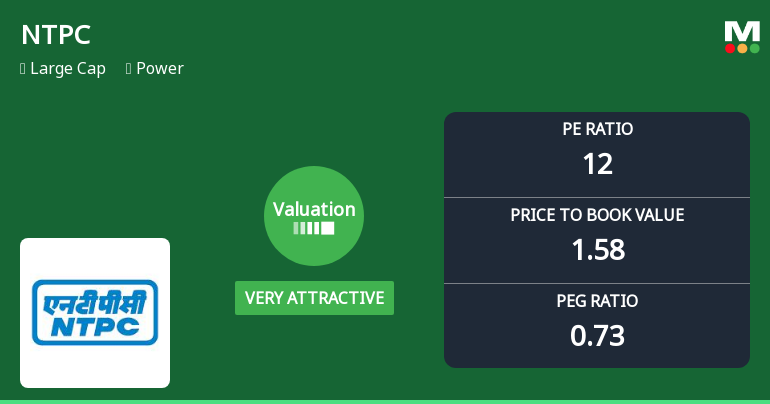
12.00

stock-summary
Industry P/E

22

stock-summary
Dividend Yield

3.70%

stock-summary
Debt Equity

1.29

stock-summary
Return on Equity

13.31%

stock-summary
Price to Book

1.58

Revenue and Profits:
Net Sales:
50,741 Cr
(Quarterly Results - Jun 2026)
Net Profit:
6,721 Cr
stock-summaryTotal Returns
Total Returns (Price + Dividend) stock-summary
Dividend Yield (3.7%)
TimePeriod
Price Return
Dividend Return
Total Return
3 Months
-9.8%
0.97%
-8.83%
6 Months
-12.37%
0.93%
-11.44%
1 Year
-1.02%
2.72%
1.7%
2 Years
-18.59%
3.66%
-14.93%
3 Years
43.41%
9.22%
52.63%
4 Years
104.48%
18.60%
123.08%
5 Years
182.78%
25.95%
208.73%

Latest dividend: 3.5 per share ex-dividend date: Sep-02-2026

Risk Adjusted Returns v/s stock-summary
Returns Beta
Icon
Beta has not been calculated since enough price history is not available
stock-summaryNews & Corporate Actions

News

P/E at 11.42 vs Industry's 21.48: What the Data Shows for NTPC Ltd.

Valuation Picture: Discount to Industry P/E

The current P/E of 11.42 for NTPC Ltd. stands in stark contrast to the power sector's average of 21.48. This valuation gap suggests the market is pricing in either structural challenges or near-term headwinds for the company relative to its peers. Such a discount is notable for a large-cap stock with a market capitalisation of ₹3,12,426.58 crores, signalling cautious investor sentiment despite the company's scale and sector leadership. The P/E differential invites scrutiny — NTPC Ltd. was previously rated Hold, but what is the current ra...

Read full news article

Announcements stock-summary

NTPC Limited - Cessation

18-Nov-2019 | Source : NSE

NTPC Limited has informed the Exchange regarding Cessation of Mr Gauri Trivedi as Non- Executive Independent Director of the company w.e.f. November 15, 2019. In line with the Corporate Disclosure requirements, we wish to inform that one year tenure of Dr. (Ms.) Gauri Trivedi as Independent Director (Non-Official Part-Time Director), appointed pursuant to office order No. 20/06/2017-Coord. Dated 22.11.2018 of the Ministry of Power, Government of India on the Board of NTPC Limited, has been completed on 15.11.2019.

NTPC Limited - Press Release

31-Oct-2019 | Source : NSE

NTPC Limited has informed the Exchange regarding a press release dated October 31, 2019, titled "Notice of Board Meeting published on 30.10.2019 ".

NTPC Limited - Trading Window

30-Oct-2019 | Source : NSE

NTPC Limited has informed the Exchange regarding the Trading Window closure pursuant to SEBI (Prohibition of Insider Trading) Regulations, 2015

Corporate Actions stock-summary

stock-summary
BOARD MEETING

No Upcoming Board Meetings

stock-summary
DIVIDEND

NTPC Ltd. has declared 35% dividend, ex-date: 02 Sep 26

stock-summary
SPLITS

No Splits history available

stock-summary
BONUS

NTPC Ltd. has announced 1:5 bonus issue, ex-date: 19 Mar 19

stock-summary
RIGHTS

No Rights history available

stock-summaryKey Factors

Quality key factors stock-summary

Factor
Value
Sales Growth (5y)
10.64%
EBIT Growth (5y)
12.80%
EBIT to Interest (avg)
2.86
Debt to EBITDA (avg)
4.90
Net Debt to Equity (avg)
1.29
Sales to Capital Employed (avg)
0.43
Tax Ratio
Tax Ratio is Negative%
Dividend Payout Ratio
34.57%
Pledged Shares
0
Institutional Holding
45.74%
ROCE (avg)
8.33%
ROE (avg)
12.56%

Valuation key factors

Factor
Value
P/E Ratio
12
Industry P/E
22
Price to Book Value
1.58
EV to EBIT
15.08
EV to EBITDA
9.89
EV to Capital Employed
1.25
EV to Sales
3.05
PEG Ratio
0.73
Dividend Yield
3.70%
ROCE (Latest)
7.65%
ROE (Latest)
13.31%

Technicals key factors

Indicator
Weekly
Monthly
MACD
Bearish
Mildly Bearish
RSI
No Signal
No Signal
Bollinger Bands
Bearish
Mildly Bearish
Moving Averages
Bearish (Daily)
KST
Bearish
Bullish
Dow Theory
Mildly Bearish
Mildly Bearish
OBV
Mildly Bearish
No Trend
stock-summary Technical Indicator Scale: Bearish, Mildly Bearish, Sideways, Mildly Bullish, Bullish  Turned 
stock-summaryShareholding
Shareholding Snapshot : Jun 2026stock-summary
Shareholding Compare (%holding) stock-summary
Majority shareholders

Promoters

Pledged Promoter Holdings

None

Mutual Funds

Held by 49 Schemes (17.4%)

FIIs

Held by 702 FIIs (16.3%)

Promoter with highest holding

President Of India (51.1%)

Highest Public shareholder

Life Insurance Corporation Of India - P & Gs Fund (5.91%)

Individual Investors Holdings

2.6%

stock-summaryFinancial
[
  {
    "link": "quarterly",
    "btn_text": "All Quarterly Results",
    "header": "Quarterly Results Snapshot (Consolidated) - Jun'26 - YoY",
    "rhs": [
      {
        "prefix": "Net Sales ",
        "suffix": "YoY Growth in quarter ended Jun 2026 is 7.81% vs -3.02% in Jun 2025",
        "dir": 1
      },
      {
        "prefix": "Consolidated Net Profit ",
        "suffix": "YoY Growth in quarter ended Jun 2026 is 11.82% vs 9.80% in Jun 2025",
        "dir": 1
      }
    ],
    "table": {
      "header": [
        "Jun'26",
        "Jun'25",
        "Change(%)"
      ],
      "body": [
        {
          "field": "Net Sales",
          "val1": "50,740.96",
          "val2": "47,064.35",
          "chgp": "7.81%",
          "chgp_class": "positive"
        },
        {
          "field": "Operating Profit (PBDIT) excl Other Income",
          "val1": "16,230.59",
          "val2": "12,578.93",
          "chgp": "29.03%",
          "chgp_class": "positive"
        },
        {
          "field": "Interest",
          "val1": "3,386.04",
          "val2": "3,467.52",
          "chgp": "-2.35%",
          "chgp_class": "positive"
        },
        {
          "field": "Exceptional Items",
          "val1": "0.00",
          "val2": "0.00",
          "chgp": "",
          "chgp_class": "neutral"
        },
        {
          "field": "Consolidate Net Profit",
          "val1": "6,721.05",
          "val2": "6,010.60",
          "chgp": "11.82%",
          "chgp_class": "positive"
        },
        {
          "field": "Operating Profit Margin (Excl OI)",
          "val1": "31.99%",
          "val2": "26.73%",
          "chgp": "5.26%",
          "chgp_class": "positive"
        }
      ]
    }
  },
  {
    "link": "half-yearly",
    "btn_text": "All Half Yearly Results",
    "header": "Half Yearly Results Snapshot (Consolidated) - Sep'25",
    "rhs": [
      {
        "prefix": "Net Sales ",
        "suffix": " Growth in half year ended Sep 2025 is -1.48% vs 5.88% in Sep 2024",
        "dir": -1
      },
      {
        "prefix": "Consolidated Net Profit ",
        "suffix": " Growth in half year ended Sep 2025 is 3.06% vs 13.29% in Sep 2024",
        "dir": -1
      }
    ],
    "table": {
      "header": [
        "Sep'25",
        "Sep'24",
        "Change(%)"
      ],
      "body": [
        {
          "field": "Net Sales",
          "val1": "91,851.18",
          "val2": "93,234.93",
          "chgp": "-1.48%",
          "chgp_class": "negative"
        },
        {
          "field": "Operating Profit (PBDIT) excl Other Income",
          "val1": "25,395.69",
          "val2": "25,689.79",
          "chgp": "-1.14%",
          "chgp_class": "negative"
        },
        {
          "field": "Interest",
          "val1": "6,899.98",
          "val2": "6,756.49",
          "chgp": "2.12%",
          "chgp_class": "negative"
        },
        {
          "field": "Exceptional Items",
          "val1": "0.00",
          "val2": "0.00",
          "chgp": "",
          "chgp_class": "neutral"
        },
        {
          "field": "Consolidate Net Profit",
          "val1": "11,077.38",
          "val2": "10,748.73",
          "chgp": "3.06%",
          "chgp_class": "positive"
        },
        {
          "field": "Operating Profit Margin (Excl OI)",
          "val1": "27.65%",
          "val2": "27.55%",
          "chgp": "0.10%",
          "chgp_class": "positive"
        }
      ]
    }
  },
  {
    "link": "nine-monthly",
    "btn_text": "All Nine Monthly Results",
    "header": "Nine Monthly Results Snapshot (Consolidated) - Dec'25",
    "rhs": [
      {
        "prefix": "Net Sales ",
        "suffix": "YoY Growth in nine months ended Dec 2025 is -0.44% vs 5.67% in Dec 2024",
        "dir": -1
      },
      {
        "prefix": "Consolidated Net Profit ",
        "suffix": "YoY Growth in nine months ended Dec 2025 is 4.77% vs 7.98% in Dec 2024",
        "dir": -1
      }
    ],
    "table": {
      "header": [
        "Dec'25",
        "Dec'24",
        "Change(%)"
      ],
      "body": [
        {
          "field": "Net Sales",
          "val1": "1,37,696.86",
          "val2": "1,38,304.36",
          "chgp": "-0.44%",
          "chgp_class": "negative"
        },
        {
          "field": "Operating Profit (PBDIT) excl Other Income",
          "val1": "39,965.27",
          "val2": "39,373.52",
          "chgp": "1.50%",
          "chgp_class": "positive"
        },
        {
          "field": "Interest",
          "val1": "10,064.07",
          "val2": "9,520.03",
          "chgp": "5.71%",
          "chgp_class": "negative"
        },
        {
          "field": "Exceptional Items",
          "val1": "0.00",
          "val2": "0.00",
          "chgp": "",
          "chgp_class": "neutral"
        },
        {
          "field": "Consolidate Net Profit",
          "val1": "16,566.05",
          "val2": "15,811.24",
          "chgp": "4.77%",
          "chgp_class": "positive"
        },
        {
          "field": "Operating Profit Margin (Excl OI)",
          "val1": "29.02%",
          "val2": "28.47%",
          "chgp": "0.55%",
          "chgp_class": "positive"
        }
      ]
    }
  },
  {
    "link": "annual",
    "btn_text": "All Annual Results",
    "header": "Annual Results Snapshot (Consolidated) - Mar'26",
    "rhs": [
      {
        "prefix": "Net Sales ",
        "suffix": "YoY Growth in year ended Mar 2026 is -0.40% vs 5.38% in Mar 2025",
        "dir": -1
      },
      {
        "prefix": "Consolidated Net Profit ",
        "suffix": "YoY Growth in year ended Mar 2026 is 15.50% vs 12.54% in Mar 2025",
        "dir": 1
      }
    ],
    "table": {
      "header": [
        "Mar'26",
        "Mar'25",
        "Change(%)"
      ],
      "body": [
        {
          "field": "Net Sales",
          "val1": "1,87,378.73",
          "val2": "1,88,138.06",
          "chgp": "-0.40%",
          "chgp_class": "negative"
        },
        {
          "field": "Operating Profit (PBDIT) excl Other Income",
          "val1": "55,279.85",
          "val2": "54,127.57",
          "chgp": "2.13%",
          "chgp_class": "positive"
        },
        {
          "field": "Interest",
          "val1": "13,800.89",
          "val2": "13,168.07",
          "chgp": "4.81%",
          "chgp_class": "negative"
        },
        {
          "field": "Exceptional Items",
          "val1": "0.00",
          "val2": "0.00",
          "chgp": "",
          "chgp_class": "neutral"
        },
        {
          "field": "Consolidate Net Profit",
          "val1": "27,052.52",
          "val2": "23,422.46",
          "chgp": "15.50%",
          "chgp_class": "positive"
        },
        {
          "field": "Operating Profit Margin (Excl OI)",
          "val1": "29.50%",
          "val2": "28.77%",
          "chgp": "0.73%",
          "chgp_class": "positive"
        }
      ]
    }
  }
]

Quarterly Results Snapshot (Consolidated) - Jun'26 - YoYstock-summary

Jun'26
Jun'25
Change(%)
Net Sales
50,740.96
47,064.35
7.81%
Operating Profit (PBDIT) excl Other Income
16,230.59
12,578.93
29.03%
Interest
3,386.04
3,467.52
-2.35%
Exceptional Items
0.00
0.00
Consolidate Net Profit
6,721.05
6,010.60
11.82%
Operating Profit Margin (Excl OI)
31.99%
26.73%
5.26%
Values in Rs Cr.
Direction Arrows
Net Sales

YoY Growth in quarter ended Jun 2026 is 7.81% vs -3.02% in Jun 2025

Direction Arrows
Consolidated Net Profit

YoY Growth in quarter ended Jun 2026 is 11.82% vs 9.80% in Jun 2025

Half Yearly Results Snapshot (Consolidated) - Sep'25stock-summary

Sep'25
Sep'24
Change(%)
Net Sales
91,851.18
93,234.93
-1.48%
Operating Profit (PBDIT) excl Other Income
25,395.69
25,689.79
-1.14%
Interest
6,899.98
6,756.49
2.12%
Exceptional Items
0.00
0.00
Consolidate Net Profit
11,077.38
10,748.73
3.06%
Operating Profit Margin (Excl OI)
27.65%
27.55%
0.10%
Values in Rs Cr.
Direction Arrows
Net Sales

Growth in half year ended Sep 2025 is -1.48% vs 5.88% in Sep 2024

Direction Arrows
Consolidated Net Profit

Growth in half year ended Sep 2025 is 3.06% vs 13.29% in Sep 2024

Nine Monthly Results Snapshot (Consolidated) - Dec'25stock-summary

Dec'25
Dec'24
Change(%)
Net Sales
1,37,696.86
1,38,304.36
-0.44%
Operating Profit (PBDIT) excl Other Income
39,965.27
39,373.52
1.50%
Interest
10,064.07
9,520.03
5.71%
Exceptional Items
0.00
0.00
Consolidate Net Profit
16,566.05
15,811.24
4.77%
Operating Profit Margin (Excl OI)
29.02%
28.47%
0.55%
Values in Rs Cr.
Direction Arrows
Net Sales

YoY Growth in nine months ended Dec 2025 is -0.44% vs 5.67% in Dec 2024

Direction Arrows
Consolidated Net Profit

YoY Growth in nine months ended Dec 2025 is 4.77% vs 7.98% in Dec 2024

Annual Results Snapshot (Consolidated) - Mar'26stock-summary

Mar'26
Mar'25
Change(%)
Net Sales
1,87,378.73
1,88,138.06
-0.40%
Operating Profit (PBDIT) excl Other Income
55,279.85
54,127.57
2.13%
Interest
13,800.89
13,168.07
4.81%
Exceptional Items
0.00
0.00
Consolidate Net Profit
27,052.52
23,422.46
15.50%
Operating Profit Margin (Excl OI)
29.50%
28.77%
0.73%
Values in Rs Cr.
Direction Arrows
Net Sales

YoY Growth in year ended Mar 2026 is -0.40% vs 5.38% in Mar 2025

Direction Arrows
Consolidated Net Profit

YoY Growth in year ended Mar 2026 is 15.50% vs 12.54% in Mar 2025

stock-summaryCompany CV
About NTPC Ltd. stock-summary
stock-summary
NTPC Ltd.
Large Cap
Power
NTPC Limited is India's largest power utility company engaged in the business of generation and sale of bulk power to State Power Utilities. Other business activities of the Company includes providing Consultancy, Project Management & Supervision, Energy Trading, Oil & Gas Exploration and Coal Mining. The company operates their stations at a level of efficiency that exceeds the average in India, based upon availability factor and average plant load factor (PLF).
Company Coordinates stock-summary
Company Details
NTPC Bhawan SCOPE Complex, 7 Institutional Area Lodi Road New Delhi New Delhi : 110003
stock-summary
Tel: 91-11-24360100/7072
stock-summary
csntpc@ntpc.co.in
Registrar Details
Alankit Assignments Ltd , Alankit House , 2 E/21, Jhandewala Extension, New Delhi