
Dashboard
With HIgh Debt (Debt-Equity Ratio at 5.92 times)- the company has a Weak Long Term Fundamental Strength
- Low ability to service debt as the company has a high Debt to EBITDA ratio of 33.33 times
- The company has been able to generate a Return on Equity (avg) of 1.06% signifying low profitability per unit of shareholders funds
Flat results in Sep 25
Risky - Negative Operating Profits
Despite the size of the company, domestic mutual funds hold only 0% of the company
Stock DNA
Cement & Cement Products
INR 1,647 Cr (Small Cap)
NA (Loss Making)
36
0.00%
5.92
-106.01%
3.93
Total Returns (Price + Dividend) 
Sanghi Industrie for the last several years.
Risk Adjusted Returns v/s
Returns Beta

News

Sanghi Industries Technical Momentum Shifts Amid Mixed Market Signals
Sanghi Industries, a key player in the Cement & Cement Products sector, has exhibited a subtle shift in its technical momentum as recent market data reveals a transition from a sideways trend to a mildly bullish stance. This development is underscored by a complex interplay of technical indicators, including MACD, RSI, moving averages, and volume-based metrics, which collectively paint a nuanced picture of the stock’s near-term trajectory.
Read More
Sanghi Industries Ltd is Rated Strong Sell
Sanghi Industries Ltd is rated Strong Sell by MarketsMOJO. This rating was last updated on 22 December 2025, reflecting a reassessment of the stock’s outlook. However, all fundamentals, returns, and financial metrics discussed below are current as of 27 December 2025, providing investors with the latest perspective on the company’s position.
Read More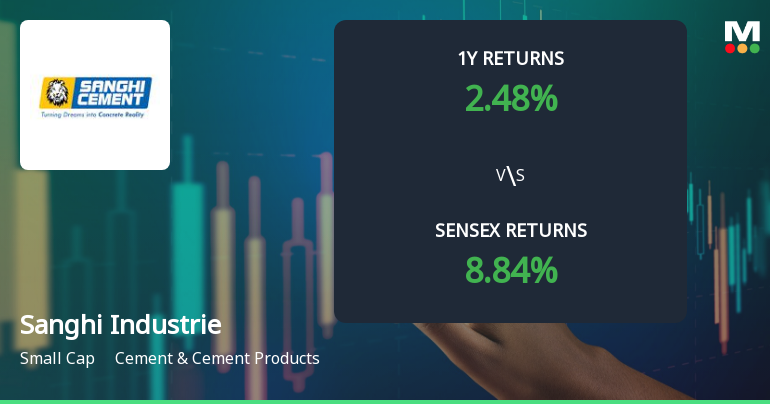
Sanghi Industries Technical Momentum Shifts Amid Mixed Market Signals
Sanghi Industries, a key player in the Cement & Cement Products sector, is currently exhibiting a nuanced shift in its technical momentum. Recent market data reveals a transition from a mildly bullish stance to a sideways trend, reflecting a complex interplay of technical indicators such as MACD, RSI, moving averages, and volume-based metrics. This article analyses these developments in detail, placing them in the context of broader market movements and historical performance.
Read More Announcements
Sanghi Industries Limited - Other General Purpose
03-Dec-2019 | Source : NSESanghi Industries Limited has informed the Exchange regarding Disclosure of related Party Transactions pursuant to Regulation 23(9) of the SEBI ( LODR) Regulations, 2015.
Sanghi Industries Limited - Analysts/Institutional Investor Meet/Con. Call Updates
13-Nov-2019 | Source : NSESanghi Industries Limited has informed the Exchange regarding Analysts/Institutional Investor Meet/Con. Call Updates
Shareholders meeting
16-Sep-2019 | Source : NSE
| Sanghi Industries Limited has informed the Exchange regarding Proceedings of Annual General Meeting held on September 14, 2019. Further, the company has submitted the Exchange a copy of Srutinizers report along with voting results. |
Corporate Actions

No Upcoming Board Meetings

No Dividend history available

No Splits history available

No Bonus history available

No Rights history available
Quality key factors
Valuation key factors
Technicals key factors
 Technical Indicator Scale: Bearish, Mildly Bearish, Sideways, Mildly Bullish, Bullish Turned
 Shareholding Snapshot : Sep 2025
Shareholding Compare (%holding)
Promoters
14.0992
Held by 1 Schemes (0.0%)
Held by 13 FIIs (0.52%)
Ambuja Cements Limited (58.08%)
None
16.99%
Quarterly Results Snapshot (Standalone) - Sep'25 - QoQ

QoQ Growth in quarter ended Sep 2025 is 16.12% vs -26.81% in Jun 2025

QoQ Growth in quarter ended Sep 2025 is -54.58% vs 35.51% in Jun 2025
Half Yearly Results Snapshot (Standalone) - Sep'25
Growth in half year ended Sep 2025 is 41.65% vs 8.00% in Sep 2024
Growth in half year ended Sep 2025 is 32.53% vs -24.64% in Sep 2024
Nine Monthly Results Snapshot (Standalone) - Dec'24
YoY Growth in nine months ended Dec 2024 is 18.21% vs -23.42% in Dec 2023
YoY Growth in nine months ended Dec 2024 is 11.25% vs -94.36% in Dec 2023
Annual Results Snapshot (Standalone) - Mar'25
YoY Growth in year ended Mar 2025 is 16.99% vs -10.44% in Mar 2024
YoY Growth in year ended Mar 2025 is -11.05% vs -37.79% in Mar 2024
About Sanghi Industries Ltd

Company Coordinates


