
Compare Sanghi Industrie with Similar Stocks
Dashboard
With HIgh Debt (Debt-Equity Ratio at 5.92 times)- the company has a Weak Long Term Fundamental Strength
- Low ability to service debt as the company has a high Debt to EBITDA ratio of 21.31 times
- The company has been able to generate a Return on Equity (avg) of 1.06% signifying low profitability per unit of shareholders funds
Negative results in Dec 25
Risky - Negative Operating Profits
Below par performance in long term as well as near term
Stock DNA
Cement & Cement Products
INR 1,273 Cr (Micro Cap)
NA (Loss Making)
34
0.00%
5.92
-110.40%
3.09
Total Returns (Price + Dividend) 
Sanghi Industrie for the last several years.
Risk Adjusted Returns v/s
Returns Beta

News
Sanghi Industries Ltd is Rated Strong Sell
Sanghi Industries Ltd is rated Strong Sell by MarketsMOJO, with this rating last updated on 16 January 2026. However, the analysis and financial metrics discussed here reflect the company’s current position as of 26 March 2026, providing investors with the latest insights into its performance and outlook.
Read full news article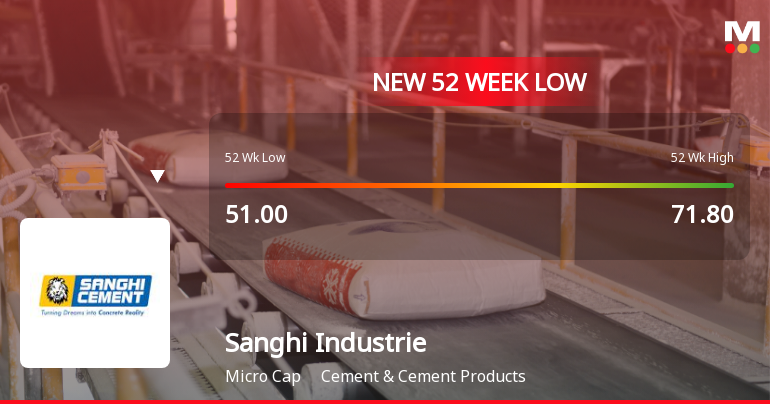
Sanghi Industries Ltd Falls to 52-Week Low of Rs 48.95 as Sell-Off Deepens
A sharp decline in Sanghi Industries Ltd shares has pushed the stock to a fresh 52-week low of Rs 48.95 on 23 Mar 2026, marking a significant 31.8% drop from its peak of Rs 71.80 in the past year. This downturn comes amid broader market weakness and company-specific financial pressures, raising questions about the sustainability of the current valuation and the outlook for recovery.
Read full news article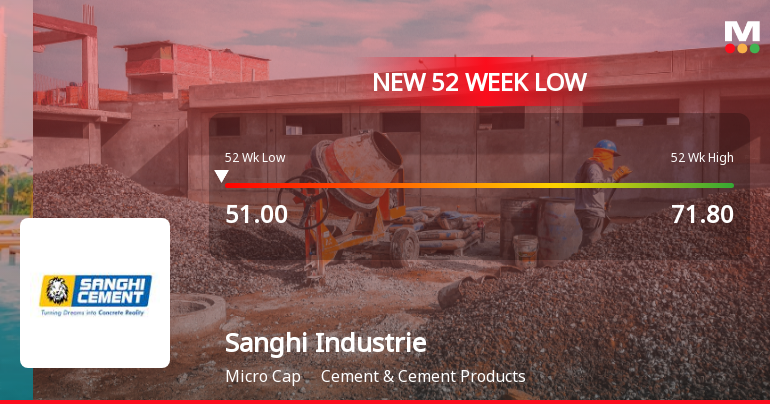
Sanghi Industries Ltd Falls to 52-Week Low Amidst Weak Financial Metrics
Sanghi Industries Ltd, a player in the Cement & Cement Products sector, has declined to a fresh 52-week low of Rs.50.81, marking a significant downturn in its stock performance amid broader market volatility and sectoral pressures.
Read full news article Announcements
Sanghi Industries Limited - Other General Purpose
03-Dec-2019 | Source : NSESanghi Industries Limited has informed the Exchange regarding Disclosure of related Party Transactions pursuant to Regulation 23(9) of the SEBI ( LODR) Regulations, 2015.
Sanghi Industries Limited - Analysts/Institutional Investor Meet/Con. Call Updates
13-Nov-2019 | Source : NSESanghi Industries Limited has informed the Exchange regarding Analysts/Institutional Investor Meet/Con. Call Updates
Shareholders meeting
16-Sep-2019 | Source : NSE
| Sanghi Industries Limited has informed the Exchange regarding Proceedings of Annual General Meeting held on September 14, 2019. Further, the company has submitted the Exchange a copy of Srutinizers report along with voting results. |
Corporate Actions

No Upcoming Board Meetings

No Dividend history available

No Splits history available

No Bonus history available

No Rights history available
Quality key factors
Valuation key factors
Technicals key factors
 Technical Indicator Scale: Bearish, Mildly Bearish, Sideways, Mildly Bullish, Bullish Turned
 Shareholding Snapshot : Dec 2025
Shareholding Compare (%holding)
Promoters
12.9142
Held by 0 Schemes
Held by 14 FIIs (1.35%)
Ambuja Cements Limited (58.08%)
Nksquared (1.41%)
16.33%
Quarterly Results Snapshot (Standalone) - Dec'25 - QoQ

QoQ Growth in quarter ended Dec 2025 is -3.49% vs 16.12% in Sep 2025

QoQ Growth in quarter ended Dec 2025 is 1.00% vs -54.58% in Sep 2025
Half Yearly Results Snapshot (Standalone) - Sep'25
Growth in half year ended Sep 2025 is 41.65% vs 8.00% in Sep 2024
Growth in half year ended Sep 2025 is 32.53% vs -24.64% in Sep 2024
Nine Monthly Results Snapshot (Standalone) - Dec'25
YoY Growth in nine months ended Dec 2025 is 27.15% vs 18.21% in Dec 2024
YoY Growth in nine months ended Dec 2025 is 19.43% vs 11.25% in Dec 2024
Annual Results Snapshot (Standalone) - Mar'25
YoY Growth in year ended Mar 2025 is 16.99% vs -10.44% in Mar 2024
YoY Growth in year ended Mar 2025 is -11.05% vs -37.79% in Mar 2024
About Sanghi Industries Ltd

Company Coordinates


