KCP

  • Market Cap: Small Cap
  • Industry: Cement & Cement Products
  • ISIN: INE805C01028
  • NSEID: KCP
  • BSEID: 590066
INR
169.50
-2.53 (-1.47%)
BSENSE

Aug 27, 12:34 PM

BSE+NSE Vol: 57.53 k

  • Price Points
  • Score
  • Mojo Parameters
  • Total Return
  • News and Corporate Actions
  • Key factors
  • Shareholding
  • Financials
  • CompanyCV
stock-summaryPrice Point
High/Low

1Day

52 Week

Valuation
Technical
Day's Volume

CASH

57.53 k (-81.67%) Volume

Shareholding (Jun 2026)

FII

2.31%

Held by 53 FIIs

DII

0.56%

Held by 1 DIIs

Promoter

44.39%

Why is KCP Ltd. falling/rising?

27-Aug-2026

As of 26-Aug, KCP Ltd.'s stock price is declining, currently at Rs 172.25, due to poor financial performance and reduced investor participation. The company has seen significant drops in profit and has underperformed its sector, leading to waning investor confidence.

As of 26-Aug, KCP Ltd. is experiencing a decline in its stock price, currently at Rs 172.25, reflecting a change of -4.4 (-2.49%). This downward movement can be attributed to several factors highlighted in the recent performance data. The stock has underperformed its sector by -3.62% today and has been on a consecutive decline for the last two days, accumulating a total drop of -2.57% during this period. Additionally, the stock reached an intraday low of Rs 171, which indicates significant selling pressure.<BR><BR>Investor participation appears to be waning, as evidenced by a 41.79% decrease in delivery volume compared to the five-day average, suggesting reduced interest from investors. Furthermore, despite trading above various moving averages, the overall sentiment remains negative due to the company's poor long-term growth prospects, with operating profit declining at an annual rate of -9.09% over the past five years.<BR><BR>Financial results have also contributed to the negative outlook; for instance, the profit before tax (PBT) has fallen by -63.67% to Rs 29.09 crore, and the profit after tax (PAT) has decreased by -42.0% to Rs 36.83 crore. These disappointing earnings figures, combined with the stock's significant underperformance relative to the broader market—where it has generated negative returns of -14.39% over the past year compared to a 3.17% gain in the BSE500—further exacerbate the decline in investor confidence.<BR><BR>In summary, KCP Ltd.'s stock price is falling due to a combination of poor financial performance, declining investor participation, and a lack of confidence from domestic mutual funds, which hold only a minimal stake in the company.

View full answer

Who are in the management team of KCP?

14-Aug-2026

The management team of KCP includes V L Indira Dutt as Chairperson & Managing Director, V Kavitha Dutt as Joint Managing Director, and Y Vijayakumar as Company Secretary. The Board also features several independent and non-executive directors, enhancing the company's governance and strategic direction.

The management team of KCP includes the following individuals:<BR><BR>1. **V L Indira Dutt** - Chairperson & Managing Director<BR>2. **V Kavitha Dutt** - Joint Managing Director<BR>3. **Y Vijayakumar** - Company Secretary & Compliance Officer<BR><BR>Additionally, the Board of Directors features several independent directors and non-executive directors:<BR><BR>- **V H Ramakrishnan** - Independent Director<BR>- **Vijay Sankar** - Independent Director<BR>- **P S Kumar** - Independent Director<BR>- **M Narasimhappa** - Independent Director<BR>- **Janaki Pillai** - Independent Director<BR>- **V. Chandrakumar Prasad** - Non-Executive & Non-Independent Director<BR>- **Subbarao Vallabhaneni** - Non-Executive & Non-Independent Director<BR>- **Ravi Chitturi** - Non-Executive & Non-Independent Director<BR><BR>This diverse team contributes to the governance and strategic direction of KCP.

View full answer

What does KCP do?

14-Aug-2026

KCP Ltd. is a small-cap multi-product company in the Cement & Cement Products industry, with recent quarterly net sales of ₹779 Cr and a net profit of ₹37 Cr. Founded in 1941, it has expanded through mergers and currently has a market cap of ₹2,002 Cr.

Overview:<BR>KCP Ltd. is a multi-product company operating in the Cement & Cement Products industry, classified as a Small Cap.<BR><BR>History:<BR>KCP Ltd. was incorporated as a Public Limited Company in July 1941. Initially a sick sugar unit, it underwent significant changes, including the merger with Challapalli Sugars in 1988, which expanded its sugar capacity. The latest quarterly results reported net sales and profit for June 2026.<BR><BR>Financial Snapshot:<BR>- Net Sales: 779 Cr (Quarterly Results - Jun 2026)<BR>- Net Profit: 37 Cr (Quarterly Results - Jun 2026)<BR>- Market Cap: INR 2,002 Cr (Small Cap)<BR><BR>Key Metrics:<BR>- P/E: 11.00<BR>- Industry P/E: 35<BR>- Dividend Yield: 0.65%<BR>- Debt Equity: -0.28<BR>- Return on Equity: 11.49%<BR>- Price to Book: 1.11<BR><BR>Contact Details:<BR>Address: Ramakrishna Buildings, 2 Dr P V Cherian Crescent Chennai Tamil Nadu : 600008<BR>Tel: 91-044-66772600<BR>Email: investor@kcp.co.in<BR>Website: http://www.kcp.co.in

View full answer

Who are the peers of the KCP?

14-Aug-2026

KCP's peers include Prism Johnson, Heidelberg Cement, Orient Cement, Mangalam Cement, Sagar Cements, Sh. Digvijay Cement, Visaka Industries, NCL Industries, Deccan Cements, and Saurashtra Cement. KCP has an average management risk, excellent capital structure, and a 1-year return of -23.64%, better than Deccan Cements but worse than Mangalam Cement, which leads with a 25.98% return.

Peers: The peers of KCP are Prism Johnson, Heidelberg Cem., Orient Cement, Mangalam Cement, Sagar Cements, Sh. Digvijay Cem, Visaka Industrie, NCL Industries, Deccan Cements, and Saurashtra Cem.<BR><BR>Quality Snapshot: Excellent management risk is observed at Heidelberg Cem., while Average management risk is found at Prism Johnson, Orient Cement, KCP, Sh. Digvijay Cem, Visaka Industrie, NCL Industries, and Deccan Cements, and the rest. Below Average management risk is noted for Mangalam Cement, Sagar Cements, and the rest. Growth is rated as Below Average for all peers except for Mangalam Cement, which has Above Average growth. Excellent capital structure is seen at Heidelberg Cem. and KCP, Good capital structure is noted for Sh. Digvijay Cem. and NCL Industries, while Below Average capital structure is found at Prism Johnson, Orient Cement, Mangalam Cement, Sagar Cements, Visaka Industrie, Deccan Cements, and the rest.<BR><BR>Return Snapshot: The peer with the highest 1-year return is Mangalam Cement at 25.98%, while the lowest is Deccan Cements at -49.02%. KCP's 1-year return of -23.64% is better than Deccan Cements but worse than Mangalam Cement. Additionally, the six-month return is negative for Heidelberg Cem., Sagar Cements, NCL Industries, and Deccan Cements.

View full answer

How big is KCP?

14-Aug-2026

As of 14th August, KCP Ltd. has a market capitalization of 2,018.91 Cr, with net sales of 2,678.99 Cr and a net profit of 170.45 Cr reported in the latest four quarters.

As of 14th August, KCP Ltd. has a market capitalization of 2,018.91 Cr, categorizing it as a Small Cap company.<BR><BR>In the latest four quarters, KCP Ltd. reported net sales of 2,678.99 Cr and a net profit of 170.45 Cr.<BR><BR>The latest annual period for the balance sheet is March 2026, showing shareholder's funds of 1,782.06 Cr and total assets of 3,581.90 Cr.

View full answer

Are KCP Ltd. latest results good or bad?

04-Aug-2026

KCP Ltd.'s latest results are concerning, showing a 15.20% revenue growth but a significant decline in net profit by 41.99% and a sharp drop in operating profit margin to 8.24%, indicating operational challenges and rising costs that overshadow the revenue increase.

KCP Ltd.'s latest results indicate a challenging situation for the company. While it achieved a revenue growth of 15.20% year-on-year, reaching ₹779.34 crores, this growth was overshadowed by significant margin compression. The operating profit margin fell sharply to 8.24% from 16.42% in the same quarter last year, highlighting difficulties in managing rising input costs.<BR><BR>The consolidated net profit also saw a drastic decline of 41.99% year-on-year, dropping to ₹36.83 crores. This decline, coupled with a 56.51% increase in interest costs, raises concerns about the company's profitability and operational efficiency.<BR><BR>Overall, the results reflect a disconnect between revenue growth and profitability, suggesting that KCP is facing substantial operational challenges in a competitive industry environment. The significant drop in profit margins and net profit indicates that the latest results are more negative than positive, raising questions about the sustainability of the company's earnings trajectory.

View full answer

Has KCP Ltd. declared dividend?

04-Aug-2026

KCP Ltd. has declared a 50% dividend, amounting to 0.4983 per share, with an ex-date of August 12, 2026. While the company has shown mixed performance in total returns, recent shorter periods reflect significant declines in price returns.

KCP Ltd. has declared a 50% dividend.<BR><BR>Dividend Details:<BR>- Percentage announced: 50%<BR>- Amount per share: 0.4983 per share<BR>- Ex-date: 12 Aug 26<BR><BR>Dividend Yield: 0.49%<BR><BR>Total Returns by Period:<BR>In the last 3 months, KCP Ltd. experienced a price return of -15.42%, a dividend return of 0.54%, resulting in a total return of -14.88%.<BR><BR>Over the past 6 months, the price return was -13.45%, while the dividend return was 0.57%, leading to a total return of -12.88%.<BR><BR>For the 1-year period, the price return was -28.14%, the dividend return was 0.49%, culminating in a total return of -27.65%.<BR><BR>In the 2-year span, KCP Ltd. saw a price return of -36.0%, a dividend return of 0.59%, resulting in a total return of -35.41%.<BR><BR>Over the last 3 years, the company had a price return of 28.78%, a dividend return of 1.95%, leading to a total return of 30.73%.<BR><BR>In the 4-year period, the price return was 40.7%, with a dividend return of 2.03%, resulting in a total return of 42.73%.<BR><BR>Finally, in the 5-year timeframe, KCP Ltd. experienced a price return of -3.78%, a dividend return of 2.41%, leading to a total return of -1.37%.<BR><BR>Overall, KCP Ltd. has declared a dividend, but the total returns over various periods show a mixed performance, with significant declines in price returns over shorter periods, while longer periods reflect positive total returns.

View full answer

Should I buy, sell or hold KCP Ltd.?

04-Aug-2026

Is KCP technically bullish or bearish?

17-Nov-2025

As of November 14, 2025, KCP's technical trend has shifted to a moderately strong bearish stance, indicated by bearish MACD, Bollinger Bands, and moving averages, along with underperformance against the Sensex.

As of 14 November 2025, the technical trend for KCP has changed from mildly bearish to bearish. The current stance is bearish with a moderate strength. Key indicators driving this conclusion include the bearish MACD on the weekly chart, bearish Bollinger Bands on both weekly and monthly time frames, and bearish moving averages on the daily chart. Additionally, the KST and Dow Theory both indicate bearish trends on the weekly chart, while the monthly indicators show a mildly bearish stance. The stock has also underperformed significantly against the Sensex over multiple time frames, further supporting the bearish outlook.

View full answer

Is KCP overvalued or undervalued?

17-Nov-2025

As of November 14, 2025, KCP is fairly valued with a PE ratio of 14.91 and has underperformed the Sensex with a year-to-date return of -18.35%, suggesting it may not be an attractive investment compared to its peers.

As of 14 November 2025, KCP's valuation grade has moved from attractive to fair, indicating a shift in its perceived value. The company is currently fairly valued, with a PE ratio of 14.91, an EV to EBITDA ratio of 6.28, and a Price to Book Value of 1.49. In comparison to its peers, KCP's valuation metrics appear reasonable, especially when contrasted with UltraTech Cement, which is very expensive at a PE of 47.72, and Grasim Industries, which is very attractive at a PE of 43.32.<BR><BR>KCP's recent stock performance has lagged behind the Sensex, with a year-to-date return of -18.35% compared to the Sensex's 8.22%. This underperformance, along with its current ratios, suggests that while KCP is fairly valued, it may not present an attractive investment opportunity at this time, especially given the high valuations of some of its peers in the cement industry.

View full answer

How has been the historical performance of KCP?

13-Nov-2025

KCP's historical performance shows fluctuating net sales, peaking at 2,846.39 Cr in March 2024 before declining to 2,528.94 Cr in March 2025, alongside a decrease in profitability metrics. Despite increased total assets to 3,098.56 Cr, the company faced challenges in cash flow management, resulting in a net cash outflow in March 2025.

Answer:<BR>The historical performance of KCP shows a fluctuating trend in net sales and profits over the years, with net sales reaching 2,528.94 Cr in March 2025, down from 2,846.39 Cr in March 2024, but up from 2,253.65 Cr in March 2023. The total operating income for March 2025 was also 2,528.94 Cr, reflecting a similar pattern. The operating profit (PBDIT) for March 2025 was 392.37 Cr, a decrease from 423.73 Cr in March 2024, but significantly higher than the 212.03 Cr recorded in March 2023. Profit before tax for March 2025 was 249.95 Cr, down from 292.89 Cr in March 2024, while profit after tax was 252.84 Cr, slightly lower than 276.22 Cr in the previous year. The consolidated net profit for March 2025 was 147.09 Cr, a decline from 188.55 Cr in March 2024, but an increase from 41.74 Cr in March 2023. The earnings per share (EPS) for March 2025 was 11.41, down from 14.63 in March 2024. <BR><BR>In terms of assets and liabilities, total assets increased to 3,098.56 Cr in March 2025 from 2,828.65 Cr in March 2024, while total liabilities also rose to 3,098.56 Cr from 2,828.65 Cr. The book value per share adjusted for March 2025 was 118.89, up from 109.4 in March 2024. Cash flow from operating activities improved to 160.00 Cr in March 2025 from 106.00 Cr in March 2024, although the net cash outflow was -6.00 Cr in March 2025 compared to a net inflow of 7.00 Cr in March 2024. Overall, KCP's financial performance reflects a mix of growth in sales and assets, alongside challenges in profitability and cash flow management in recent years. <BR><BR>Breakdown:<BR>KCP's financial performance over the years has shown variability, particularly in net sales, which peaked at 2,846.39 Cr in March 2024 before declining to 2,528.94 Cr in March 2025. The total operating income mirrored this trend, while operating profit (PBDIT) decreased from 423.73 Cr in March 2024 to 392.37 Cr in March 2025, indicating a challenging year for profitability despite higher sales compared to March 2023. Profit before tax also fell to 249.95 Cr in March 2025 from 292.89 Cr in the previous year, and profit after tax was slightly lower at 252.84 Cr. The consolidated net profit for March 2025 was 147.09 Cr, a notable decrease from 188.55 Cr in March 2024 but a significant improvement from 41.74 Cr in March 2023. The company's total assets increased to 3,098.56 Cr in March 2025, reflecting growth in both current and non-current assets, while total liabilities rose correspondingly. Cash flow from operating activities improved, but the overall cash position showed a net outflow in March 2025, highlighting ongoing challenges in cash management despite positive operational cash flow.

View full answer

Who are the top shareholders of the KCP?

17-Jul-2025

The top shareholders of KCP include V Ramakrishna Sons P Ltd with a 30.22% stake, individual investors with 41.88%, and 62 Foreign Institutional Investors holding 3.31%. There are no pledged promoter holdings, and the highest public shareholder is Citibank N A Jt Ac R Srinivasan, with a stake listed as 0%.

The top shareholders of KCP include V Ramakrishna Sons P Ltd, which holds the highest promoter stake at 30.22%. Additionally, individual investors collectively own 41.88% of the company. There are also 62 Foreign Institutional Investors (FIIs) holding a combined 3.31%. It's worth noting that there are no pledged promoter holdings and mutual funds hold a negligible amount in two schemes. The highest public shareholder is Citibank N A Jt Ac R Srinivasan, although their stake is listed as 0%.

View full answer

When is the next results date for KCP?

06-Jun-2025

No Upcoming Board Meetings

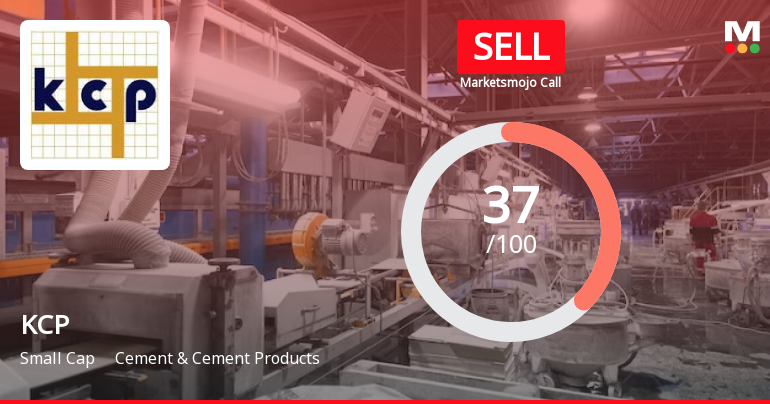
iScoreScore
Click here to find our call on this stock
Strong Sell
Sell
Hold
Buy
Strong Buy

Dashboard

1

Poor long term growth as Operating profit has grown by an annual rate -9.09% of over the last 5 years

 
2

Flat results in Jun 26

3

Despite the size of the company, domestic mutual funds hold only 0.01% of the company

4

Underperformed the market in the last 1 year

stock-summaryMojo Parameters

Mojo Parameters

Loading Valuation Snapshot...

Stock DNA

stock-summary
Industry

Cement & Cement Products

stock-summary
Market cap

INR 2,185 Cr (Small Cap)

stock-summary
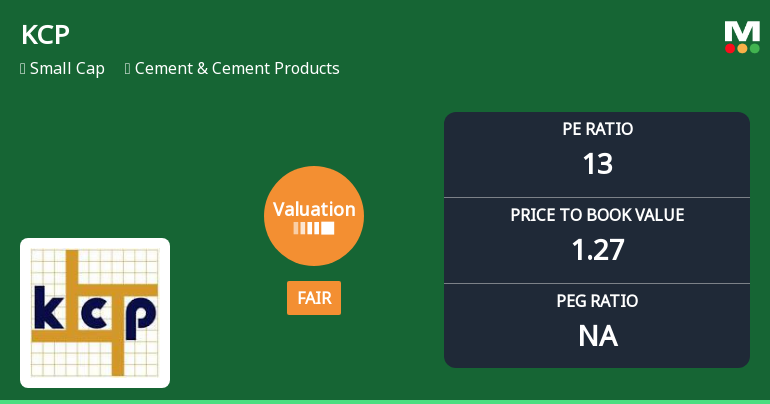
P/E

12.00

stock-summary
Industry P/E

34

stock-summary
Dividend Yield

0.58%

stock-summary
Debt Equity

-0.28

stock-summary
Return on Equity

11.49%

stock-summary
Price to Book

1.25

Revenue and Profits:
Net Sales:
779 Cr
(Quarterly Results - Jun 2026)
Net Profit:
37 Cr
stock-summaryTotal Returns
Total Returns (Price + Dividend) stock-summary
Dividend Yield (0.58%)
TimePeriod
Price Return
Dividend Return
Total Return
3 Months
4.82%
0.61%
5.43%
6 Months
7.21%
0.62%
7.83%
1 Year
-15.75%
0.50%
-15.25%
2 Years
-28.23%
0.50%
-27.73%
3 Years
48.36%
1.93%
50.29%
4 Years
43.34%
2.03%
45.37%
5 Years
22.38%
2.40%
24.78%

Latest dividend: 0.49886030608922166 per share ex-dividend date: Aug-12-2026

Risk Adjusted Returns v/s stock-summary
Returns Beta
Icon
Beta has not been calculated since enough price history is not available
stock-summaryNews & Corporate Actions

News

KCP Ltd Gains 4.63%: 2 Key Factors Driving the Week’s Volatility

Announcements stock-summary

KCP Limited - Other General Purpose

28-Nov-2019 | Source : NSE

KCP Limited has informed the Exchange that Under Regulation 23(9) Enclosing herewith the Statement of Related Party Transactions for half year ended 30th September 2019.

KCP Limited - Updates

30-Oct-2019 | Source : NSE

KCP Limited has informed the Exchange regarding 'Certificate under Reg 74(5) of SEBI (DP) Regulations 2018 received from our RTA M/s. Integrated Registry Management Services for September 2019 for your information and records'.

Updates

08-Aug-2019 | Source : NSE

KCP Limited has informed the Exchange regarding 'Enclosing herewith the 78th AGM Proceedings and Scrutinizer Report for your information and records.'.

Corporate Actions stock-summary

stock-summary
BOARD MEETING

No Upcoming Board Meetings

stock-summary
DIVIDEND

KCP Ltd. has declared 50% dividend, ex-date: 12 Aug 26

stock-summary
SPLITS

KCP Ltd. has announced 1:10 stock split, ex-date: 02 Sep 10

stock-summary
BONUS

No Bonus history available

stock-summary
RIGHTS

No Rights history available

stock-summaryKey Factors

Quality key factors stock-summary

Factor
Value
Sales Growth (5y)
7.01%
EBIT Growth (5y)
-9.09%
EBIT to Interest (avg)
6.22
Debt to EBITDA (avg)
1.85
Net Debt to Equity (avg)
-0.28
Sales to Capital Employed (avg)
1.28
Tax Ratio
2.32%
Dividend Payout Ratio
2.19%
Pledged Shares
0
Institutional Holding
2.87%
ROCE (avg)
20.65%
ROE (avg)
11.12%

Valuation key factors

Factor
Value
P/E Ratio
12
Industry P/E
34
Price to Book Value
1.25
EV to EBIT
8.29
EV to EBITDA
5.82
EV to Capital Employed
1.34
EV to Sales
0.64
PEG Ratio
NA
Dividend Yield
0.58%
ROCE (Latest)
20.13%
ROE (Latest)
11.49%

Technicals key factors

Indicator
Weekly
Monthly
MACD
Mildly Bullish
Bearish
RSI
No Signal
No Signal
Bollinger Bands
Bullish
Mildly Bearish
Moving Averages
Mildly Bearish (Daily)
KST
Mildly Bearish
Bearish
Dow Theory
Mildly Bullish
Mildly Bearish
OBV
Bullish
No Trend
stock-summary Technical Indicator Scale: Bearish, Mildly Bearish, Sideways, Mildly Bullish, Bullish  Turned 
stock-summaryShareholding
Shareholding Snapshot : Jun 2026stock-summary
Shareholding Compare (%holding) stock-summary
Majority shareholders

Non Institution

Pledged Promoter Holdings

None

Mutual Funds

Held by 2 Schemes (0.0%)

FIIs

Held by 53 FIIs (2.31%)

Promoter with highest holding

V Ramakrishna Sons P Ltd (30.22%)

Highest Public shareholder

Sandhya G Parikh (3.02%)

Individual Investors Holdings

42.46%

stock-summaryFinancial
[
  {
    "link": "quarterly",
    "btn_text": "All Quarterly Results",
    "header": "Quarterly Results Snapshot (Consolidated) - Jun'26 - YoY",
    "rhs": [
      {
        "prefix": "Net Sales ",
        "suffix": "YoY Growth in quarter ended Jun 2026 is 15.20% vs -2.10% in Jun 2025",
        "dir": 1
      },
      {
        "prefix": "Consolidated Net Profit ",
        "suffix": "YoY Growth in quarter ended Jun 2026 is -41.99% vs 97.54% in Jun 2025",
        "dir": -1
      }
    ],
    "table": {
      "header": [
        "Jun'26",
        "Jun'25",
        "Change(%)"
      ],
      "body": [
        {
          "field": "Net Sales",
          "val1": "779.34",
          "val2": "676.51",
          "chgp": "15.20%",
          "chgp_class": "positive"
        },
        {
          "field": "Operating Profit (PBDIT) excl Other Income",
          "val1": "64.21",
          "val2": "111.09",
          "chgp": "-42.20%",
          "chgp_class": "negative"
        },
        {
          "field": "Interest",
          "val1": "9.97",
          "val2": "8.93",
          "chgp": "11.65%",
          "chgp_class": "negative"
        },
        {
          "field": "Exceptional Items",
          "val1": "0.00",
          "val2": "0.00",
          "chgp": "",
          "chgp_class": "neutral"
        },
        {
          "field": "Consolidate Net Profit",
          "val1": "36.83",
          "val2": "63.49",
          "chgp": "-41.99%",
          "chgp_class": "negative"
        },
        {
          "field": "Operating Profit Margin (Excl OI)",
          "val1": "8.24%",
          "val2": "16.42%",
          "chgp": "-8.18%",
          "chgp_class": "negative"
        }
      ]
    }
  },
  {
    "link": "half-yearly",
    "btn_text": "All Half Yearly Results",
    "header": "Half Yearly Results Snapshot (Consolidated) - Sep'25",
    "rhs": [
      {
        "prefix": "Net Sales ",
        "suffix": " Growth in half year ended Sep 2025 is -1.19% vs -10.46% in Sep 2024",
        "dir": 1
      },
      {
        "prefix": "Consolidated Net Profit ",
        "suffix": " Growth in half year ended Sep 2025 is 3.22% vs 48.65% in Sep 2024",
        "dir": -1
      }
    ],
    "table": {
      "header": [
        "Sep'25",
        "Sep'24",
        "Change(%)"
      ],
      "body": [
        {
          "field": "Net Sales",
          "val1": "1,278.04",
          "val2": "1,293.49",
          "chgp": "-1.19%",
          "chgp_class": "negative"
        },
        {
          "field": "Operating Profit (PBDIT) excl Other Income",
          "val1": "193.24",
          "val2": "180.09",
          "chgp": "7.30%",
          "chgp_class": "positive"
        },
        {
          "field": "Interest",
          "val1": "19.07",
          "val2": "18.68",
          "chgp": "2.09%",
          "chgp_class": "negative"
        },
        {
          "field": "Exceptional Items",
          "val1": "1.87",
          "val2": "-10.57",
          "chgp": "117.69%",
          "chgp_class": "positive"
        },
        {
          "field": "Consolidate Net Profit",
          "val1": "96.51",
          "val2": "93.50",
          "chgp": "3.22%",
          "chgp_class": "positive"
        },
        {
          "field": "Operating Profit Margin (Excl OI)",
          "val1": "15.12%",
          "val2": "13.92%",
          "chgp": "1.20%",
          "chgp_class": "positive"
        }
      ]
    }
  },
  {
    "link": "nine-monthly",
    "btn_text": "All Nine Monthly Results",
    "header": "Nine Monthly Results Snapshot (Consolidated) - Dec'25",
    "rhs": [
      {
        "prefix": "Net Sales ",
        "suffix": "YoY Growth in nine months ended Dec 2025 is -0.09% vs -14.74% in Dec 2024",
        "dir": 1
      },
      {
        "prefix": "Consolidated Net Profit ",
        "suffix": "YoY Growth in nine months ended Dec 2025 is 2.28% vs -17.65% in Dec 2024",
        "dir": 1
      }
    ],
    "table": {
      "header": [
        "Dec'25",
        "Dec'24",
        "Change(%)"
      ],
      "body": [
        {
          "field": "Net Sales",
          "val1": "1,892.41",
          "val2": "1,894.16",
          "chgp": "-0.09%",
          "chgp_class": "negative"
        },
        {
          "field": "Operating Profit (PBDIT) excl Other Income",
          "val1": "224.87",
          "val2": "228.87",
          "chgp": "-1.75%",
          "chgp_class": "negative"
        },
        {
          "field": "Interest",
          "val1": "26.96",
          "val2": "25.55",
          "chgp": "5.52%",
          "chgp_class": "negative"
        },
        {
          "field": "Exceptional Items",
          "val1": "-8.37",
          "val2": "-26.98",
          "chgp": "68.98%",
          "chgp_class": "positive"
        },
        {
          "field": "Consolidate Net Profit",
          "val1": "112.00",
          "val2": "109.50",
          "chgp": "2.28%",
          "chgp_class": "positive"
        },
        {
          "field": "Operating Profit Margin (Excl OI)",
          "val1": "11.88%",
          "val2": "12.08%",
          "chgp": "-0.20%",
          "chgp_class": "negative"
        }
      ]
    }
  },
  {
    "link": "annual",
    "btn_text": "All Annual Results",
    "header": "Annual Results Snapshot (Consolidated) - Mar'26",
    "rhs": [
      {
        "prefix": "Net Sales ",
        "suffix": "YoY Growth in year ended Mar 2026 is 1.87% vs -11.15% in Mar 2025",
        "dir": 1
      },
      {
        "prefix": "Consolidated Net Profit ",
        "suffix": "YoY Growth in year ended Mar 2026 is 34.01% vs -21.99% in Mar 2025",
        "dir": 1
      }
    ],
    "table": {
      "header": [
        "Mar'26",
        "Mar'25",
        "Change(%)"
      ],
      "body": [
        {
          "field": "Net Sales",
          "val1": "2,576.16",
          "val2": "2,528.94",
          "chgp": "1.87%",
          "chgp_class": "positive"
        },
        {
          "field": "Operating Profit (PBDIT) excl Other Income",
          "val1": "342.56",
          "val2": "331.19",
          "chgp": "3.43%",
          "chgp_class": "positive"
        },
        {
          "field": "Interest",
          "val1": "33.33",
          "val2": "31.99",
          "chgp": "4.19%",
          "chgp_class": "negative"
        },
        {
          "field": "Exceptional Items",
          "val1": "-8.63",
          "val2": "-25.48",
          "chgp": "66.13%",
          "chgp_class": "positive"
        },
        {
          "field": "Consolidate Net Profit",
          "val1": "197.11",
          "val2": "147.09",
          "chgp": "34.01%",
          "chgp_class": "positive"
        },
        {
          "field": "Operating Profit Margin (Excl OI)",
          "val1": "13.30%",
          "val2": "13.10%",
          "chgp": "0.20%",
          "chgp_class": "positive"
        }
      ]
    }
  }
]

Quarterly Results Snapshot (Consolidated) - Jun'26 - YoYstock-summary

Jun'26
Jun'25
Change(%)
Net Sales
779.34
676.51
15.20%
Operating Profit (PBDIT) excl Other Income
64.21
111.09
-42.20%
Interest
9.97
8.93
11.65%
Exceptional Items
0.00
0.00
Consolidate Net Profit
36.83
63.49
-41.99%
Operating Profit Margin (Excl OI)
8.24%
16.42%
-8.18%
Values in Rs Cr.
Direction Arrows
Net Sales

YoY Growth in quarter ended Jun 2026 is 15.20% vs -2.10% in Jun 2025

Direction Arrows
Consolidated Net Profit

YoY Growth in quarter ended Jun 2026 is -41.99% vs 97.54% in Jun 2025

Half Yearly Results Snapshot (Consolidated) - Sep'25stock-summary

Sep'25
Sep'24
Change(%)
Net Sales
1,278.04
1,293.49
-1.19%
Operating Profit (PBDIT) excl Other Income
193.24
180.09
7.30%
Interest
19.07
18.68
2.09%
Exceptional Items
1.87
-10.57
117.69%
Consolidate Net Profit
96.51
93.50
3.22%
Operating Profit Margin (Excl OI)
15.12%
13.92%
1.20%
Values in Rs Cr.
Direction Arrows
Net Sales

Growth in half year ended Sep 2025 is -1.19% vs -10.46% in Sep 2024

Direction Arrows
Consolidated Net Profit

Growth in half year ended Sep 2025 is 3.22% vs 48.65% in Sep 2024

Nine Monthly Results Snapshot (Consolidated) - Dec'25stock-summary

Dec'25
Dec'24
Change(%)
Net Sales
1,892.41
1,894.16
-0.09%
Operating Profit (PBDIT) excl Other Income
224.87
228.87
-1.75%
Interest
26.96
25.55
5.52%
Exceptional Items
-8.37
-26.98
68.98%
Consolidate Net Profit
112.00
109.50
2.28%
Operating Profit Margin (Excl OI)
11.88%
12.08%
-0.20%
Values in Rs Cr.
Direction Arrows
Net Sales

YoY Growth in nine months ended Dec 2025 is -0.09% vs -14.74% in Dec 2024

Direction Arrows
Consolidated Net Profit

YoY Growth in nine months ended Dec 2025 is 2.28% vs -17.65% in Dec 2024

Annual Results Snapshot (Consolidated) - Mar'26stock-summary

Mar'26
Mar'25
Change(%)
Net Sales
2,576.16
2,528.94
1.87%
Operating Profit (PBDIT) excl Other Income
342.56
331.19
3.43%
Interest
33.33
31.99
4.19%
Exceptional Items
-8.63
-25.48
66.13%
Consolidate Net Profit
197.11
147.09
34.01%
Operating Profit Margin (Excl OI)
13.30%
13.10%
0.20%
Values in Rs Cr.
Direction Arrows
Net Sales

YoY Growth in year ended Mar 2026 is 1.87% vs -11.15% in Mar 2025

Direction Arrows
Consolidated Net Profit

YoY Growth in year ended Mar 2026 is 34.01% vs -21.99% in Mar 2025

stock-summaryCompany CV
About KCP Ltd. stock-summary
stock-summary
KCP Ltd.
Small Cap
Cement & Cement Products
K.C.P. Limited was incorporated as a Public Limited Company in July, 1941. A multi-product company with two sugar mills, downstream distillery, a cement plant and an engineering division, KCP was initially a sick sugar unit (cap. : 600 tpd). It was taken over by the late Velagapudi Ramakrishna in 1941. The merger of Challapalli Sugars - a BIFR company - with it in 1988 and expansions have increased its sugar capacity tenfold to 6300 tpd over the last five decades.
Company Coordinates stock-summary
Company Details
Ramakrishna Buildings, 2 Dr P V Cherian Crescent Chennai Tamil Nadu : 600008
stock-summary
Tel: 91-044-66772600
stock-summary
investor@kcp.co.in
Registrar Details
Integrated Enterprises (India) Ltd , II Floor , Kences Towers, No 1 Ramakrishna Street, North Usman Road, T Nagar, Chennai