
Compare Sagar Cements with Similar Stocks
Dashboard
Weak Long Term Fundamental Strength with a -30.37% CAGR growth in Operating Profits over the last 5 years
- Low ability to service debt as the company has a high Debt to EBITDA ratio of 5.85 times
- The company has been able to generate a Return on Equity (avg) of 1.22% signifying low profitability per unit of shareholders funds
81.2% of Promoter Shares are Pledged
Below par performance in long term as well as near term
Stock DNA
Cement & Cement Products
INR 2,275 Cr (Small Cap)
NA (Loss Making)
33
0.00%
1.00
-0.65%
1.35
Total Returns (Price + Dividend) 
Latest dividend: 0.7037649402390438 per share ex-dividend date: Jun-19-2024
Risk Adjusted Returns v/s
Returns Beta

News
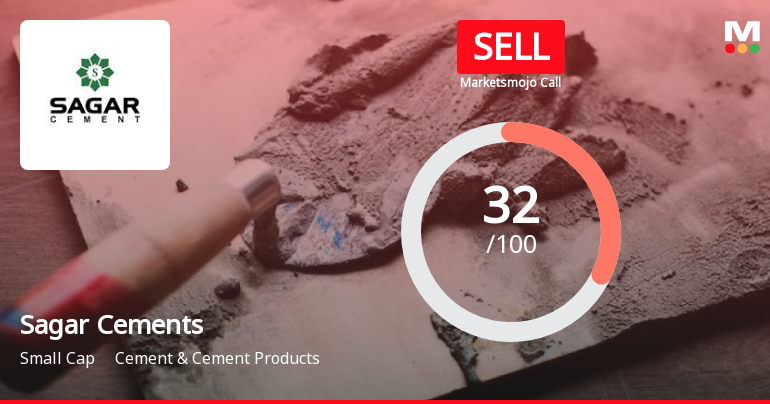
Sagar Cements Ltd is Rated Sell
Sagar Cements Ltd is rated 'Sell' by MarketsMOJO, with this rating last updated on 15 June 2026. However, all fundamentals, returns, and financial metrics discussed here reflect the stock's current position as of 08 July 2026, providing investors with an up-to-date analysis of the company’s standing in the market.
Read full news article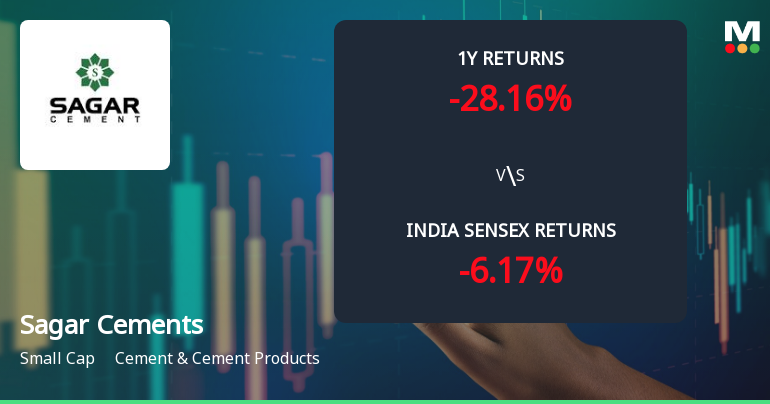
Sagar Cements Ltd Technical Analysis: Momentum Shifts Amid Bearish Trends
Sagar Cements Ltd has experienced a notable shift in its technical momentum, moving from a mildly bearish stance to a more pronounced bearish trend. Despite some mildly bullish signals on weekly indicators, the overall technical landscape remains challenging for the small-cap cement company, with key metrics such as MACD, RSI, and moving averages signalling caution for investors.
Read full news article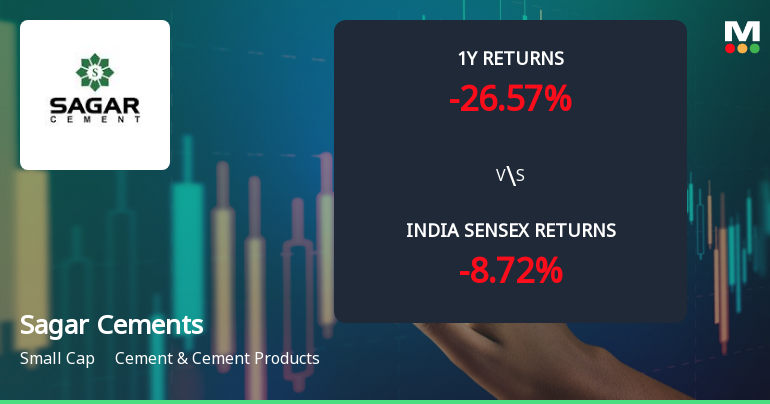
Sagar Cements Ltd Technical Momentum Shifts Amid Mixed Market Signals
Sagar Cements Ltd, a small-cap player in the Cement & Cement Products sector, has experienced a nuanced shift in its technical momentum, moving from a bearish to a mildly bearish trend. Despite a recent downgrade in its Mojo Grade from Strong Sell to Sell, the stock exhibits a complex interplay of technical indicators that suggest cautious optimism tempered by persistent headwinds.
Read full news article Announcements
Sagar Cements Limited - Monthly Business Updates
09-Dec-2019 | Source : NSESagar Cements Limited has informed the Exchange regarding Monthly Business Updates for the month of November 2019
Sagar Cements Limited - Other General Purpose
18-Nov-2019 | Source : NSESagar Cements Limited has informed the Exchange regarding Disclosure under Regulation 23 (9) of SEBI (LODR) Regulations 2015.
Sagar Cements Limited - Monthly Business Updates
06-Nov-2019 | Source : NSESagar Cements Limited has informed the Exchange regarding Monthly Business Updates for the month of October 2019
Corporate Actions

No Upcoming Board Meetings

Sagar Cements Ltd has declared 35% dividend, ex-date: 19 Jun 24

Sagar Cements Ltd has announced 2:10 stock split, ex-date: 17 Aug 21

No Bonus history available

No Rights history available
Quality key factors
Valuation key factors
Technicals key factors
 Technical Indicator Scale: Bearish, Mildly Bearish, Sideways, Mildly Bullish, Bullish Turned
 Shareholding Snapshot : Mar 2026
Shareholding Compare (%holding)
Promoters
81.2046
Held by 7 Schemes (7.43%)
Held by 28 FIIs (1.66%)
R V Consulting Services Private Limited (9.24%)
Avh Resources India Private Limited (19.64%)
8.44%
Quarterly Results Snapshot (Consolidated) - Mar'26 - QoQ

QoQ Growth in quarter ended Mar 2026 is 33.26% vs -1.88% in Dec 2025
QoQ Growth in quarter ended Mar 2026 is 252.14% vs -36.09% in Dec 2025
Half Yearly Results Snapshot (Consolidated) - Sep'25
Growth in half year ended Sep 2025 is 22.86% vs -8.06% in Sep 2024
Growth in half year ended Sep 2025 is 51.05% vs -75.26% in Sep 2024
Nine Monthly Results Snapshot (Consolidated) - Dec'25
YoY Growth in nine months ended Dec 2025 is 16.47% vs -10.93% in Dec 2024
YoY Growth in nine months ended Dec 2025 is 29.02% vs -148.38% in Dec 2024
Annual Results Snapshot (Consolidated) - Mar'26
YoY Growth in year ended Mar 2026 is 17.38% vs -9.86% in Mar 2025
YoY Growth in year ended Mar 2026 is 94.72% vs -383.83% in Mar 2025
About Sagar Cements Ltd

Company Coordinates


