Lyka Labs

  • Market Cap: Micro Cap
  • Industry: Pharmaceuticals & Biotechnology
  • ISIN: INE933A01014
  • NSEID: LYKALABS
  • BSEID: 500259
INR
74.50
0.00 (0.00%)
BSENSE

Aug 26, 03:30 PM

BSE+NSE Vol: 9.23 k

  • Price Points
  • Score
  • Mojo Parameters
  • Total Return
  • News and Corporate Actions
  • Key factors
  • Shareholding
  • Financials
  • CompanyCV
stock-summaryPrice Point
High/Low

1Day

52 Week

Valuation
Technical
Day's Volume

CASH

9.23 k (327.51%) Volume

Shareholding (Jun 2026)

FII

0.17%

Held by 5 FIIs

DII

0.66%

Held by 2 DIIs

Promoter

58.45%

Why is Lyka Labs Ltd falling/rising?

27-Aug-2026

As of 26-Aug, Lyka Labs Ltd's stock price is rising to 74.40, up 1.32%. This increase is driven by strong performance compared to the Sensex, significant growth over the past month, and heightened investor interest.

As of 26-Aug, Lyka Labs Ltd's stock price is rising, currently at 74.40, reflecting an increase of 0.97 (1.32%). This upward movement can be attributed to several factors. Over the past week, the stock has outperformed the benchmark Sensex, gaining 5.37% compared to the Sensex's 0.73%. Additionally, the stock has shown significant growth over the past month, with a 17.04% increase, while the Sensex only rose by 1.86%. <BR><BR>Today's performance indicates that Lyka Labs is trading above its moving averages across various time frames, including the 5-day, 20-day, 50-day, 100-day, and 200-day averages, which is a positive sign for investors. Furthermore, there has been a notable increase in investor participation, with delivery volume on 25 August rising by 1415.11% against the 5-day average, suggesting heightened interest in the stock. <BR><BR>Overall, these factors contribute to the rising stock price of Lyka Labs Ltd.

View full answer

Should I buy, sell or hold Lyka Labs Ltd?

26-Aug-2026

Who are in the management team of Lyka Labs?

14-Aug-2026

The management team of Lyka Labs includes Kunal Narendra Gandhi (Chairman, Managing Director, and CEO), Sandeep P Parikh (Non-Executive Independent Director), Yogesh B Shah (CFO), Dhara P. Shah (Non-Executive Independent Director), Kishore P Shah (Company Secretary), Babulal Jain (Independent Director), Prashant Godha (Director), and Shashil Mendonsa (Director). They are responsible for the company's strategic direction and operations.

The management team of Lyka Labs includes the following key individuals:<BR><BR>1. **Kunal Narendra Gandhi** - Chairman, Managing Director, and CEO<BR>2. **Sandeep P Parikh** - Non-Executive and Independent Director<BR>3. **Yogesh B Shah** - Executive Director and Chief Financial Officer<BR>4. **Dhara P. Shah** - Non-Executive and Independent Director<BR>5. **Kishore P Shah** - Company Secretary and Compliance Officer<BR>6. **Babulal Jain** - Independent Director<BR>7. **Prashant Godha** - Director<BR>8. **Shashil Mendonsa** - Director<BR><BR>This team plays a crucial role in guiding the company's strategic direction and operations.

View full answer

What does Lyka Labs do?

14-Aug-2026

Lyka Labs Ltd is a micro-cap company in the pharmaceuticals and biotechnology sector, focusing on healthcare products, including ayurvedic and animal health care. As of June 2026, it reported net sales of 42 Cr and a net profit of 2 Cr.

Overview: <BR>Lyka Labs Ltd is a company engaged in the pharmaceuticals and biotechnology industry, operating within the micro-cap market segment.<BR><BR>History: <BR>Lyka Labs Ltd was incorporated in 1983, initially focusing on manufacturing formulations. It expanded its operations by merging with Lyphin Chemicals Pvt Ltd in April 1983 and has since diversified into various healthcare products, including ayurvedic and animal health care products. The latest quarterly results reported net sales and profit for June 2026.<BR><BR>Financial Snapshot: <BR>Most recent Net Sales: 42 Cr (Quarterly Results - Jun 2026) <BR>Most recent Net Profit: 2 Cr (Quarterly Results - Jun 2026) <BR>Market-cap value: INR 242 Cr (Micro Cap)<BR><BR>Key Metrics: <BR>P/E: N/A <BR>Industry P/E: 37 <BR>Dividend Yield: 0.00% <BR>Debt-Equity: 0.51 <BR>Return on Equity: -10.87% <BR>Price to Book: 2.62<BR><BR>Contact Details: <BR>Address: 4801/B & 4802/A, GIDC Industrial Estate Ankleshwar Gujarat : 393002 <BR>Tel: 91-02646-221422/220549 <BR>Email: companysecretary@lykalabs.com <BR>Website: http://www.lykalabs.com

View full answer

Who are the peers of the Lyka Labs?

14-Aug-2026

Lyka Labs' peers include Everest Organics, Astonea Labs, Zenotech Lab, Aarey Drugs, Oxygenta Pharma, Sanjiv.Parant, Gennex Lab, Nectar Lifesci, and Accretion Pha. Lyka Labs has average management risk, below average growth, and the lowest 1-year return at -34.01% compared to its peers.

Peers: The peers of Lyka Labs are Everest Organics, Astonea Labs, Zenotech Lab., Aarey Drugs, Oxygenta Pharma, Sanjiv.Parant., Gennex Lab., Nectar Lifesci., and Accretion Pha.<BR><BR>Quality Snapshot: Excellent management risk is observed at Sanjiv.Parant. and Accretion Pha., while Average management risk is found at Everest Organics, Astonea Labs, Zenotech Lab., Gennex Lab., Nectar Lifesci., and Lyka Labs, and the rest. Below Average management risk is noted at Aarey Drugs. In terms of Growth, Excellent growth is seen at Accretion Pha. and Good growth at Astonea Labs, Sanjiv.Parant., and Gennex Lab., while Below Average growth is present at Everest Organics, Zenotech Lab., Aarey Drugs, Lyka Labs, and Nectar Lifesci., and the rest. Capital Structure is Excellent at Zenotech Lab. and Gennex Lab., Below Average at Everest Organics, Astonea Labs, Aarey Drugs, Lyka Labs, and Nectar Lifesci., and the rest.<BR><BR>Return Snapshot: Astonea Labs has the highest 1-year return at 62.76%, while Lyka Labs has the lowest at -34.01%. Compared to its peers, Lyka Labs' return is significantly lower. Additionally, the six-month return is negative for Everest Organics, Zenotech Lab., Gennex Lab., and Nectar Lifesci.

View full answer

How big is Lyka Labs?

14-Aug-2026

As of 14th August, Lyka Labs Ltd has a market capitalization of 242.22 Cr and reported Net Sales of 137.73 Cr, with a Net Profit loss of 8.90 Cr over the latest four quarters. Shareholder's Funds are valued at 92.39 Cr, and Total Assets amount to 174.54 Cr as of March 2026.

As of 14th August, Lyka Labs Ltd has a market capitalization of 242.22 Cr, categorizing it as a Micro Cap company.<BR><BR>In the latest four quarters, Lyka Labs reported Net Sales of 137.73 Cr. However, the company experienced a loss of 8.90 Cr in Net Profit during the same period.<BR><BR>The latest reporting period for the balance sheet is March 2026. Shareholder's Funds are valued at 92.39 Cr, while Total Assets amount to 174.54 Cr.

View full answer

When is the next results date for Lyka Labs Ltd?

27-Jul-2026

The next results date for Lyka Labs Ltd is 10 August 2026.

The next results date for Lyka Labs Ltd is scheduled for 10 August 2026.

View full answer

Are Lyka Labs Ltd latest results good or bad?

26-May-2026

Lyka Labs Ltd's latest Q4 FY26 results are concerning, showing a net loss of ₹7.61 crores and a 16.15% revenue decline, marking the lowest quarterly revenue in seven quarters. Analysts have downgraded the company's financial outlook to "Negative," indicating significant operational challenges and a bleak future without a turnaround strategy.

Lyka Labs Ltd's latest results for Q4 FY26 are concerning and indicate a significant deterioration in financial performance. The company reported a net loss of ₹7.61 crores, which marks a drastic decline of 529.94% year-on-year. Revenue also fell to ₹28.03 crores, down 16.15% compared to the same quarter last year and representing the lowest quarterly revenue in the past seven quarters.<BR><BR>The operating margin has turned deeply negative at -23.05%, the worst level recorded, and the profit after tax (PAT) margin is at -28.79%, highlighting severe operational inefficiencies. The company's financial trend has been downgraded to "Negative" by analysts, reflecting growing concerns about its operational viability.<BR><BR>Additionally, the stock has underperformed significantly, declining 47.08% over the past year, which is starkly worse than both the Sensex and the pharmaceuticals sector. Overall, these results suggest that Lyka Labs is facing a critical operational crisis, and the outlook appears bleak without a clear turnaround strategy.

View full answer

Is Lyka Labs overvalued or undervalued?

14-Nov-2025

As of November 13, 2025, Lyka Labs is considered overvalued with a high PE ratio of 156.53 and a significant decline in performance, contrasting with its peers, which have more attractive valuations and growth expectations.

As of 13 November 2025, Lyka Labs has moved from an attractive to a fair valuation grade, indicating a shift in its perceived investment quality. The company is currently considered overvalued based on its high PE ratio of 156.53, an EV to EBIT of 119.79, and a Price to Book Value of 3.16. These ratios suggest that the stock is trading at a premium compared to its earnings and book value.<BR><BR>In comparison to its peers, Lyka Labs' PE ratio significantly exceeds that of Cipla, which stands at 22.65, and Dr. Reddy's Labs at 17.86, both of which are classified as attractive. Additionally, while Lyka Labs has a PEG ratio of 0.00, indicating no growth expectations, its peers like Sun Pharma and Divi's Lab are categorized as expensive with PEG ratios of 11.96 and 1.99, respectively. The recent performance of Lyka Labs shows a substantial decline, with a year-to-date return of -43.61%, contrasting sharply with the Sensex's positive return of 8.11% during the same period, further reinforcing the overvaluation narrative.

View full answer

How has been the historical performance of Lyka Labs?

13-Nov-2025

Lyka Labs has shown fluctuating historical performance, with net sales increasing from 93.07 Cr in Mar'23 to 138.50 Cr in Mar'25, while total operating income peaked at 194.08 Cr in Mar'22 before declining. Despite rising costs and low cash flow, the company improved profitability, achieving a profit after tax of 7.93 Cr in Mar'25, recovering from previous losses.

Answer:<BR>The historical performance of Lyka Labs shows a fluctuating trajectory over the years, with notable improvements in recent periods.<BR><BR>Breakdown:<BR>Lyka Labs' net sales increased from 93.07 Cr in Mar'23 to 138.50 Cr in Mar'25, reflecting a positive growth trend. However, the total operating income peaked at 194.08 Cr in Mar'22 before declining to 138.50 Cr in Mar'25. The total expenditure, excluding depreciation, rose from 76.23 Cr in Mar'23 to 120.56 Cr in Mar'25, indicating rising costs. Operating profit (PBDIT) showed volatility, with a high of 103.24 Cr in Mar'22, dropping to 20.17 Cr in Mar'25. Profit before tax improved to 11.12 Cr in Mar'25 from a loss of 13.23 Cr in Mar'23, while profit after tax also turned positive at 7.93 Cr in Mar'25, recovering from losses in previous years. The company's total assets increased to 176.21 Cr in Mar'25, up from 151.52 Cr in Mar'23, and total liabilities also rose to 176.21 Cr in Mar'25. Cash flow from operating activities remained low at 1.00 Cr in Mar'25, with a net cash outflow of 4.00 Cr. Overall, while Lyka Labs has shown signs of recovery in profitability and sales, it continues to face challenges with rising costs and cash flow management.

View full answer

What is the technical trend for Lyka Labs?

09-Jun-2025

As of June 2, 2025, Lyka Labs shows a mildly bearish trend, supported by daily moving averages and a bearish monthly MACD, despite mixed signals from the weekly MACD and Bollinger Bands.

As of 2 June 2025, the technical trend for Lyka Labs has changed from sideways to mildly bearish. The weekly MACD is mildly bullish, but the monthly MACD is mildly bearish, indicating mixed signals. The daily moving averages are also mildly bearish, reinforcing the bearish sentiment. Bollinger Bands on the monthly chart show a bearish trend, while both the KST and Dow Theory indicate no clear trend on a monthly basis. Overall, the current stance is mildly bearish, with the daily moving averages and monthly MACD being key indicators driving this outlook.

View full answer

Who are the top shareholders of the Lyka Labs?

06-Jun-2025

The top shareholders of Lyka Labs primarily include promoters, with Ipca Laboratories Limited as the largest shareholder at 40.98%. Other notable shareholders are Thermo Capital Private Limited (1.55%) and individual investors (31.18%), along with minimal stakes from mutual funds and foreign institutional investors.

The top shareholders of Lyka Labs include several key players. The majority of the shares are held by promoters, with Ipca Laboratories Limited being the largest individual shareholder, holding 40.98%. Other notable shareholders include Thermo Capital Private Limited, which holds 1.55%, and individual investors collectively owning 31.18%. Additionally, there are four mutual fund schemes with a very small stake of 0.01% and five foreign institutional investors (FIIs) holding 0.23%. Overall, the promoter group plays a significant role in the ownership structure of Lyka Labs.

View full answer

Has Lyka Labs declared dividend?

06-Jun-2025

No Dividend History Available

iScoreScore
Click here to find our call on this stock
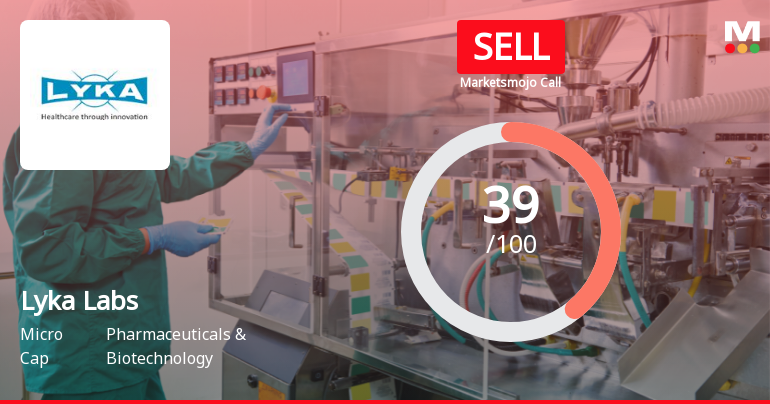
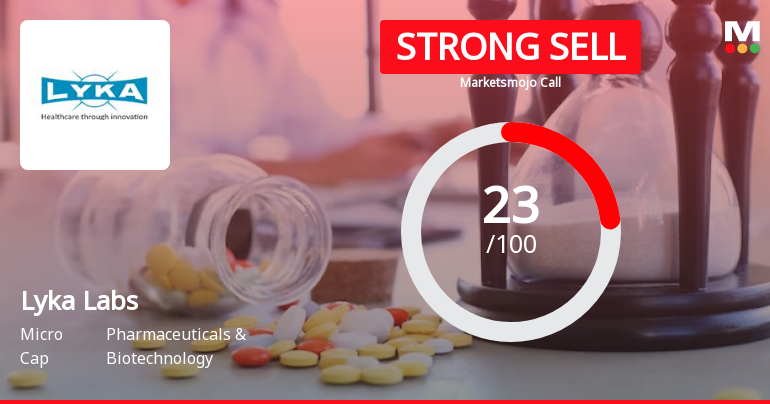
Strong Sell
Sell
Hold
Buy
Strong Buy

Dashboard

1

High Debt company with Weak Long Term Fundamental Strength

  • Poor long term growth as Operating profit has grown by an annual rate -178.57% of over the last 5 years
  • High Debt Company with a Debt to Equity ratio (avg) of 2.30 times
2

Risky - Negative EBITDA

stock-summaryMojo Parameters

Mojo Parameters

Loading Valuation Snapshot...

Stock DNA

stock-summary
Industry

Pharmaceuticals & Biotechnology

stock-summary
Market cap

INR Cr (Micro Cap)

stock-summary
P/E

NA (Loss Making)

stock-summary
Industry P/E

27

stock-summary
Dividend Yield

0.00%

stock-summary
Debt Equity

0.00

stock-summary
Return on Equity

0.00%

stock-summary
Price to Book

0.00

Revenue and Profits:
Net Sales:
42 Cr
(Quarterly Results - Jun 2026)
Net Profit:
2 Cr
stock-summaryTotal Returns
Total Returns (Price + Dividend) stock-summary
Dividend Yield (%)
TimePeriod
Price Return
Dividend Return
Total Return
3 Months
29.36%
0%
29.36%
6 Months
19.49%
0%
19.49%
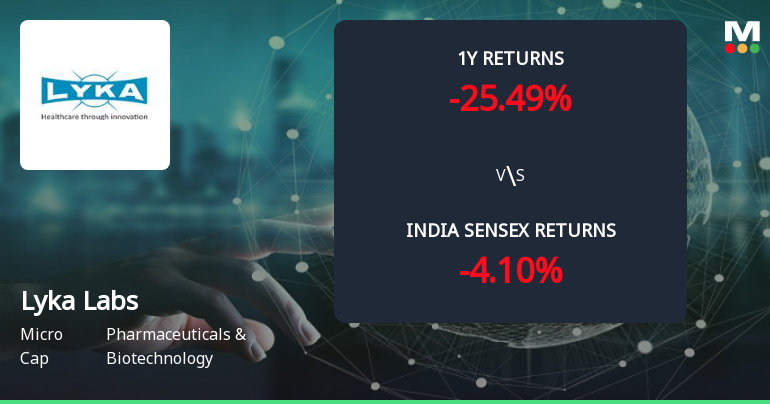
1 Year
-25.46%
0%
-25.46%
2 Years
-50.1%
0%
-50.1%
3 Years
-38.73%
0%
-38.73%
4 Years
-50.53%
0%
-50.53%
5 Years
-2.68%
0%
-2.68%

Lyka Labs for the last several years.

Risk Adjusted Returns v/s stock-summary
Returns Beta
Icon
Beta has not been calculated since enough price history is not available
stock-summaryNews & Corporate Actions

Announcements stock-summary

Lyka Labs Limited - Reply to Clarification- Financial results

03-Dec-2019 | Source : NSE

Lyka Labs Limited Labs Limited for the quarter ended 30-Jun-2019 with respect to Regulation 33 of the SEBI (Listing Obligations and Disclosure Requirements) Regulations, 2015.

Lyka Labs Limited - Other General Purpose

28-Nov-2019 | Source : NSE

Lyka Labs Limited has informed the Exchange regarding Disclosure of Related Party Transaction disclosure under Regulation 23(9) of the SEBI (Listing Obligations and Disclosure Requirements) Regulations, 2015.

Lyka Labs Limited - Updates

22-Nov-2019 | Source : NSE

Lyka Labs Limited has informed the Exchange regarding 'This is to inform pursuant to Regulation 30 of SEBI (Listing Obligations and Disclosure Requirements), Regulations, 2015, that the Company has entered into Loan Agreement with International Asset Reconstruction Company Private Limited (hereinafter referred to as IARC ).

Corporate Actions stock-summary

stock-summary
BOARD MEETING

No Upcoming Board Meetings

stock-summary
DIVIDEND

No Dividend history available

stock-summary
SPLITS

No Splits history available

stock-summary
BONUS

No Bonus history available

stock-summary
RIGHTS

No Rights history available

stock-summaryKey Factors

Quality key factors stock-summary

Factor
Value
Sales Growth (5y)
3.15%
EBIT Growth (5y)
-178.57%
EBIT to Interest (avg)
1.19
Debt to EBITDA (avg)
1.26
Net Debt to Equity (avg)
0.51
Sales to Capital Employed (avg)
0.97
Tax Ratio
16.10%
Dividend Payout Ratio
0
Pledged Shares
0
Institutional Holding
0.83%
ROCE (avg)
14.94%
ROE (avg)
69.08%

Valuation key factors

Factor
Value
P/E Ratio
NA (Loss Making)
Industry P/E
37
Price to Book Value
2.91
EV to EBIT
-28.38
EV to EBITDA
-113.02
EV to Capital Employed
2.26
EV to Sales
2.30
PEG Ratio
NA
Dividend Yield
NA
ROCE (Latest)
-8.66%
ROE (Latest)
-10.87%

Technicals key factors

Indicator
Weekly
Monthly
MACD
Bullish
Bearish
RSI
No Signal
No Signal
Bollinger Bands
Bullish
Mildly Bearish
Moving Averages
Bullish (Daily)
KST
Bullish
Bearish
Dow Theory
Mildly Bullish
No Trend
OBV
Mildly Bullish
No Trend
stock-summary Technical Indicator Scale: Bearish, Mildly Bearish, Sideways, Mildly Bullish, Bullish  Turned 
stock-summaryShareholding
Shareholding Snapshot : Jun 2026stock-summary
Shareholding Compare (%holding) stock-summary
Majority shareholders

Promoters

Pledged Promoter Holdings

None

Mutual Funds

Held by 4 Schemes (0.01%)

FIIs

Held by 5 FIIs (0.17%)

Promoter with highest holding

Ipca Laboratories Limited (40.45%)

Highest Public shareholder

Thermo Capital Private Limited (1.94%)

Individual Investors Holdings

31.18%

stock-summaryFinancial
[
  {
    "link": "quarterly",
    "btn_text": "All Quarterly Results",
    "header": "Quarterly Results Snapshot (Consolidated) - Jun'26 - YoY",
    "rhs": [
      {
        "prefix": "Net Sales ",
        "suffix": "YoY Growth in quarter ended Jun 2026 is 28.10% vs 9.70% in Jun 2025",
        "dir": 1
      },
      {
        "prefix": "Consolidated Net Profit ",
        "suffix": "YoY Growth in quarter ended Jun 2026 is 122.58% vs -35.42% in Jun 2025",
        "dir": 1
      }
    ],
    "table": {
      "header": [
        "Jun'26",
        "Jun'25",
        "Change(%)"
      ],
      "body": [
        {
          "field": "Net Sales",
          "val1": "42.31",
          "val2": "33.03",
          "chgp": "28.10%",
          "chgp_class": "positive"
        },
        {
          "field": "Operating Profit (PBDIT) excl Other Income",
          "val1": "4.55",
          "val2": "3.69",
          "chgp": "23.31%",
          "chgp_class": "positive"
        },
        {
          "field": "Interest",
          "val1": "1.01",
          "val2": "0.85",
          "chgp": "18.82%",
          "chgp_class": "negative"
        },
        {
          "field": "Exceptional Items",
          "val1": "0.00",
          "val2": "0.00",
          "chgp": "",
          "chgp_class": "neutral"
        },
        {
          "field": "Consolidate Net Profit",
          "val1": "2.07",
          "val2": "0.93",
          "chgp": "122.58%",
          "chgp_class": "positive"
        },
        {
          "field": "Operating Profit Margin (Excl OI)",
          "val1": "10.75%",
          "val2": "11.17%",
          "chgp": "-0.42%",
          "chgp_class": "negative"
        }
      ]
    }
  },
  {
    "link": "half-yearly",
    "btn_text": "All Half Yearly Results",
    "header": "Half Yearly Results Snapshot (Consolidated) - Sep'25",
    "rhs": [
      {
        "prefix": "Net Sales ",
        "suffix": " Growth in half year ended Sep 2025 is -2.22% vs 40.13% in Sep 2024",
        "dir": -1
      },
      {
        "prefix": "Consolidated Net Profit ",
        "suffix": " Growth in half year ended Sep 2025 is -168.36% vs 251.93% in Sep 2024",
        "dir": -1
      }
    ],
    "table": {
      "header": [
        "Sep'25",
        "Sep'24",
        "Change(%)"
      ],
      "body": [
        {
          "field": "Net Sales",
          "val1": "69.69",
          "val2": "71.27",
          "chgp": "-2.22%",
          "chgp_class": "negative"
        },
        {
          "field": "Operating Profit (PBDIT) excl Other Income",
          "val1": "1.15",
          "val2": "8.66",
          "chgp": "-86.72%",
          "chgp_class": "negative"
        },
        {
          "field": "Interest",
          "val1": "1.64",
          "val2": "1.19",
          "chgp": "37.82%",
          "chgp_class": "negative"
        },
        {
          "field": "Exceptional Items",
          "val1": "0.00",
          "val2": "0.00",
          "chgp": "",
          "chgp_class": "neutral"
        },
        {
          "field": "Consolidate Net Profit",
          "val1": "-2.42",
          "val2": "3.54",
          "chgp": "-168.36%",
          "chgp_class": "negative"
        },
        {
          "field": "Operating Profit Margin (Excl OI)",
          "val1": "1.65%",
          "val2": "12.15%",
          "chgp": "-10.50%",
          "chgp_class": "negative"
        }
      ]
    }
  },
  {
    "link": "nine-monthly",
    "btn_text": "All Nine Monthly Results",
    "header": "Nine Monthly Results Snapshot (Consolidated) - Dec'25",
    "rhs": [
      {
        "prefix": "Net Sales ",
        "suffix": "YoY Growth in nine months ended Dec 2025 is -4.43% vs 25.95% in Dec 2024",
        "dir": -1
      },
      {
        "prefix": "Consolidated Net Profit ",
        "suffix": "YoY Growth in nine months ended Dec 2025 is -138.78% vs 1,234.55% in Dec 2024",
        "dir": -1
      }
    ],
    "table": {
      "header": [
        "Dec'25",
        "Dec'24",
        "Change(%)"
      ],
      "body": [
        {
          "field": "Net Sales",
          "val1": "100.42",
          "val2": "105.07",
          "chgp": "-4.43%",
          "chgp_class": "negative"
        },
        {
          "field": "Operating Profit (PBDIT) excl Other Income",
          "val1": "2.80",
          "val2": "13.85",
          "chgp": "-79.78%",
          "chgp_class": "negative"
        },
        {
          "field": "Interest",
          "val1": "2.46",
          "val2": "1.80",
          "chgp": "36.67%",
          "chgp_class": "negative"
        },
        {
          "field": "Exceptional Items",
          "val1": "0.00",
          "val2": "0.00",
          "chgp": "",
          "chgp_class": "neutral"
        },
        {
          "field": "Consolidate Net Profit",
          "val1": "-2.42",
          "val2": "6.24",
          "chgp": "-138.78%",
          "chgp_class": "negative"
        },
        {
          "field": "Operating Profit Margin (Excl OI)",
          "val1": "2.79%",
          "val2": "13.18%",
          "chgp": "-10.39%",
          "chgp_class": "negative"
        }
      ]
    }
  },
  {
    "link": "annual",
    "btn_text": "All Annual Results",
    "header": "Annual Results Snapshot (Consolidated) - Mar'26",
    "rhs": [
      {
        "prefix": "Net Sales ",
        "suffix": "YoY Growth in year ended Mar 2026 is -7.26% vs 24.56% in Mar 2025",
        "dir": -1
      },
      {
        "prefix": "Consolidated Net Profit ",
        "suffix": "YoY Growth in year ended Mar 2026 is -225.22% vs 405.73% in Mar 2025",
        "dir": -1
      }
    ],
    "table": {
      "header": [
        "Mar'26",
        "Mar'25",
        "Change(%)"
      ],
      "body": [
        {
          "field": "Net Sales",
          "val1": "128.44",
          "val2": "138.50",
          "chgp": "-7.26%",
          "chgp_class": "negative"
        },
        {
          "field": "Operating Profit (PBDIT) excl Other Income",
          "val1": "-3.66",
          "val2": "17.94",
          "chgp": "-120.40%",
          "chgp_class": "negative"
        },
        {
          "field": "Interest",
          "val1": "3.16",
          "val2": "2.27",
          "chgp": "39.21%",
          "chgp_class": "negative"
        },
        {
          "field": "Exceptional Items",
          "val1": "0.00",
          "val2": "0.00",
          "chgp": "",
          "chgp_class": "neutral"
        },
        {
          "field": "Consolidate Net Profit",
          "val1": "-10.03",
          "val2": "8.01",
          "chgp": "-225.22%",
          "chgp_class": "negative"
        },
        {
          "field": "Operating Profit Margin (Excl OI)",
          "val1": "-2.85%",
          "val2": "12.95%",
          "chgp": "-15.80%",
          "chgp_class": "negative"
        }
      ]
    }
  }
]

Quarterly Results Snapshot (Consolidated) - Jun'26 - YoYstock-summary

Jun'26
Jun'25
Change(%)
Net Sales
42.31
33.03
28.10%
Operating Profit (PBDIT) excl Other Income
4.55
3.69
23.31%
Interest
1.01
0.85
18.82%
Exceptional Items
0.00
0.00
Consolidate Net Profit
2.07
0.93
122.58%
Operating Profit Margin (Excl OI)
10.75%
11.17%
-0.42%
Values in Rs Cr.
Direction Arrows
Net Sales

YoY Growth in quarter ended Jun 2026 is 28.10% vs 9.70% in Jun 2025

Direction Arrows
Consolidated Net Profit

YoY Growth in quarter ended Jun 2026 is 122.58% vs -35.42% in Jun 2025

Half Yearly Results Snapshot (Consolidated) - Sep'25stock-summary

Sep'25
Sep'24
Change(%)
Net Sales
69.69
71.27
-2.22%
Operating Profit (PBDIT) excl Other Income
1.15
8.66
-86.72%
Interest
1.64
1.19
37.82%
Exceptional Items
0.00
0.00
Consolidate Net Profit
-2.42
3.54
-168.36%
Operating Profit Margin (Excl OI)
1.65%
12.15%
-10.50%
Values in Rs Cr.
Direction Arrows
Net Sales

Growth in half year ended Sep 2025 is -2.22% vs 40.13% in Sep 2024

Direction Arrows
Consolidated Net Profit

Growth in half year ended Sep 2025 is -168.36% vs 251.93% in Sep 2024

Nine Monthly Results Snapshot (Consolidated) - Dec'25stock-summary

Dec'25
Dec'24
Change(%)
Net Sales
100.42
105.07
-4.43%
Operating Profit (PBDIT) excl Other Income
2.80
13.85
-79.78%
Interest
2.46
1.80
36.67%
Exceptional Items
0.00
0.00
Consolidate Net Profit
-2.42
6.24
-138.78%
Operating Profit Margin (Excl OI)
2.79%
13.18%
-10.39%
Values in Rs Cr.
Direction Arrows
Net Sales

YoY Growth in nine months ended Dec 2025 is -4.43% vs 25.95% in Dec 2024

Direction Arrows
Consolidated Net Profit

YoY Growth in nine months ended Dec 2025 is -138.78% vs 1,234.55% in Dec 2024

Annual Results Snapshot (Consolidated) - Mar'26stock-summary

Mar'26
Mar'25
Change(%)
Net Sales
128.44
138.50
-7.26%
Operating Profit (PBDIT) excl Other Income
-3.66
17.94
-120.40%
Interest
3.16
2.27
39.21%
Exceptional Items
0.00
0.00
Consolidate Net Profit
-10.03
8.01
-225.22%
Operating Profit Margin (Excl OI)
-2.85%
12.95%
-15.80%
Values in Rs Cr.
Direction Arrows
Net Sales

YoY Growth in year ended Mar 2026 is -7.26% vs 24.56% in Mar 2025

Direction Arrows
Consolidated Net Profit

YoY Growth in year ended Mar 2026 is -225.22% vs 405.73% in Mar 2025

stock-summaryCompany CV
About Lyka Labs Ltd stock-summary
stock-summary
Lyka Labs Ltd
Micro Cap
Pharmaceuticals & Biotechnology
Initially manufacturing formulations, Lyka Labs Limited brought bulk drugs into its operational fold by amalgamating Lyphin Chemicals Pvt Ltd with itself in Apr. '83. It also added a range of ayurvedic and animal health care products over the years. In 1990, it diversified into marketing medical and diagnostic equipment and instruments of Bekton Dickinson, US; Airsep Corporation, US; Coloplast, Denmark; and Terumo Corporation, Japan. Lyka Exports is the subsidiary of the company.
Company Coordinates stock-summary
Company Details
4801/B & 4802/A, GIDC Industrial Estate Ankleshwar Gujarat : 393002
stock-summary
Tel: 91-02646-221422/220549
stock-summary
companysecretary@lykalabs.com
Registrar Details
Sharex Dynamic (India) Pvt Ltd , Unit -1, Luthra Ind. Premises , Safed Pool, Andheri-Kurla Road, Andheri (E), Mumbai