
Compare Lyka Labs with Similar Stocks
Dashboard
With a Operating Losses, the company has a Weak Long Term Fundamental Strength
- Poor long term growth as Operating profit has grown by an annual rate -201.29% of over the last 5 years
- High Debt Company with a Debt to Equity ratio (avg) of 2.30 times
The company has declared Negative results for the last 3 consecutive quarters
Risky - Negative EBITDA
Consistent Underperformance against the benchmark over the last 3 years
Stock DNA
Pharmaceuticals & Biotechnology
INR 227 Cr (Micro Cap)
NA (Loss Making)
37
0.00%
0.51
-10.87%
2.47
Total Returns (Price + Dividend) 
Lyka Labs for the last several years.
Risk Adjusted Returns v/s
Returns Beta

News
Lyka Labs Ltd is Rated Strong Sell
Lyka Labs Ltd is rated Strong Sell by MarketsMOJO, with this rating last updated on 12 January 2026. However, the analysis and financial metrics discussed here reflect the stock’s current position as of 26 July 2026, providing investors with the latest insights into the company’s performance and outlook.
Read full news article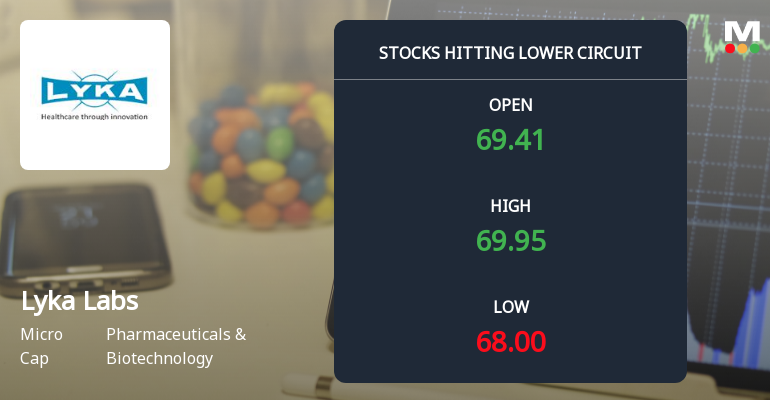
Lyka Labs Ltd Locks at Lower Circuit With 5% Loss — Sellers Queue, No Buyers in Sight
At Rs 65.3, sellers were still queuing — but there were no buyers willing to take the other side. Lyka Labs Ltd locked at its lower circuit of 5% on 21 Jul 2026, with unfilled sell orders and a frozen price, signalling a pronounced imbalance in supply and demand.
Read full news article
Lyka Labs Ltd is Rated Strong Sell
Lyka Labs Ltd is rated Strong Sell by MarketsMOJO. This rating was last updated on 12 January 2026, reflecting a significant reassessment of the stock’s outlook. However, all fundamentals, returns, and financial metrics discussed here are current as of 15 July 2026, providing investors with the latest perspective on the company’s position.
Read full news article Announcements
Lyka Labs Limited - Reply to Clarification- Financial results
03-Dec-2019 | Source : NSELyka Labs Limited Labs Limited for the quarter ended 30-Jun-2019 with respect to Regulation 33 of the SEBI (Listing Obligations and Disclosure Requirements) Regulations, 2015.
Lyka Labs Limited - Other General Purpose
28-Nov-2019 | Source : NSELyka Labs Limited has informed the Exchange regarding Disclosure of Related Party Transaction disclosure under Regulation 23(9) of the SEBI (Listing Obligations and Disclosure Requirements) Regulations, 2015.
Lyka Labs Limited - Updates
22-Nov-2019 | Source : NSELyka Labs Limited has informed the Exchange regarding 'This is to inform pursuant to Regulation 30 of SEBI (Listing Obligations and Disclosure Requirements), Regulations, 2015, that the Company has entered into Loan Agreement with International Asset Reconstruction Company Private Limited (hereinafter referred to as IARC ).
Corporate Actions

No Upcoming Board Meetings

No Dividend history available

No Splits history available

No Bonus history available

No Rights history available
Quality key factors
Valuation key factors
Technicals key factors
 Technical Indicator Scale: Bearish, Mildly Bearish, Sideways, Mildly Bullish, Bullish Turned
 Shareholding Snapshot : Jun 2026
Shareholding Compare (%holding)
Promoters
None
Held by 4 Schemes (0.01%)
Held by 5 FIIs (0.17%)
Ipca Laboratories Limited (40.45%)
Thermo Capital Private Limited (1.94%)
31.18%
Quarterly Results Snapshot (Consolidated) - Mar'26 - YoY

YoY Growth in quarter ended Mar 2026 is -16.15% vs 20.38% in Mar 2025
YoY Growth in quarter ended Mar 2026 is -529.94% vs 184.69% in Mar 2025
Half Yearly Results Snapshot (Consolidated) - Sep'25
Growth in half year ended Sep 2025 is -2.22% vs 40.13% in Sep 2024
Growth in half year ended Sep 2025 is -168.36% vs 251.93% in Sep 2024
Nine Monthly Results Snapshot (Consolidated) - Dec'25
YoY Growth in nine months ended Dec 2025 is -4.43% vs 25.95% in Dec 2024
YoY Growth in nine months ended Dec 2025 is -138.78% vs 1,234.55% in Dec 2024
Annual Results Snapshot (Consolidated) - Mar'26
YoY Growth in year ended Mar 2026 is -7.26% vs 24.56% in Mar 2025
YoY Growth in year ended Mar 2026 is -225.22% vs 405.73% in Mar 2025
About Lyka Labs Ltd

Company Coordinates


