
Compare Shyam Telecom with Similar Stocks
Dashboard
With a Negative Book Value, the company has a Weak Long Term Fundamental Strength
- Poor long term growth as Net Sales has grown by an annual rate of -10.95% and Operating profit at 0% over the last 5 years
- The company has a negative book value of Rs 33.02 crore
Flat results in Mar 26
Risky - Negative EBITDA
Stock DNA
Trading & Distributors
INR 18 Cr (Micro Cap)
NA (Loss Making)
22
0.00%
0.00
15.23%
-0.55
Total Returns (Price + Dividend) 
Shyam Telecom for the last several years.
Risk Adjusted Returns v/s
Returns Beta

News

Shyam Telecom Ltd Upgraded to Sell on Technical Improvements Despite Weak Fundamentals
Shyam Telecom Ltd, a micro-cap player in the Trading & Distributors sector, has seen its investment rating upgraded from Strong Sell to Sell as of 27 Jul 2026, reflecting a nuanced shift in its technical outlook despite persistent fundamental challenges. The company’s stock price edged up 1.95% to ₹16.17, signalling cautious optimism among investors amid mixed signals across quality, valuation, financial trends, and technical parameters.
Read full news article
Shyam Telecom Ltd Downgraded to Strong Sell Amid Weak Fundamentals and Technical Setbacks
Shyam Telecom Ltd, a micro-cap player in the Trading & Distributors sector, has been downgraded from a Sell to a Strong Sell rating as of 20 Jul 2026. This revision reflects deteriorating technical indicators, weak financial trends, poor valuation metrics, and declining quality scores, signalling heightened risk for investors amid a challenging market environment.
Read full news article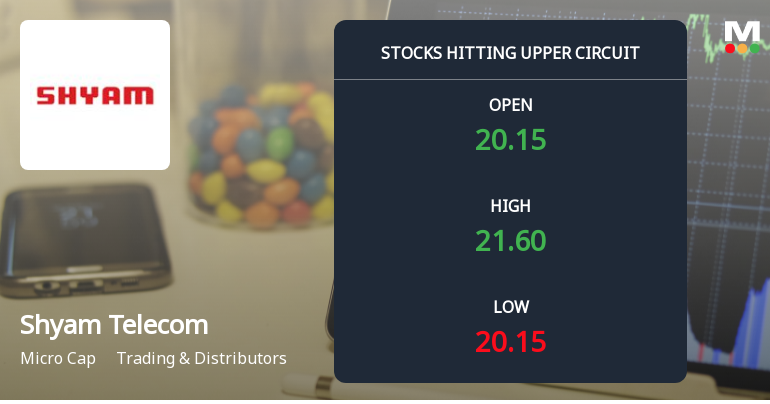
Shyam Telecom Ltd Locks at Upper Circuit With 4.96% Gain — Buyers Queue, Sellers Absent
At Rs 20.95, the buying was done — not because demand dried up, but because the exchange wouldn't let the stock go any higher. Shyam Telecom Ltd locked at its upper circuit of 4.96% on 23 Jun 2026, with buyers queuing and no sellers willing to part with shares.
Read full news article Announcements
Shyam Telecom Limited - Other General Purpose
18-Nov-2019 | Source : NSEShyam Telecom Limited has submitted to the Exchange a copy ofá Compliance under Regulation 23(9) of the Securities and Exchange Board of India (Listing Obligations and Disclosure Requirements) Regulations, 2015, as amended.
Shyam Telecom Limited - Outcome of Board Meeting
14-Nov-2019 | Source : NSEShyam Telecom Limited has informed the Exchange regarding Board meeting held on November 13, 2019.
Shyam Telecom Limited - Trading Window
05-Nov-2019 | Source : NSEShyam Telecom Limited has informed the Exchange regarding the Trading Window closure pursuant to SEBI (Prohibition of Insider Trading) Regulations, 2015
Corporate Actions

No Upcoming Board Meetings

No Dividend history available

No Splits history available

No Bonus history available

No Rights history available
Quality key factors
Valuation key factors
Technicals key factors
 Technical Indicator Scale: Bearish, Mildly Bearish, Sideways, Mildly Bullish, Bullish Turned
 Shareholding Snapshot : Jun 2026
Shareholding Compare (%holding)
Promoters
None
Held by 0 Schemes
Held by 0 FIIs
Intell Invofin India Pvt Ltd (15.06%)
Madhvi Sharma (2.88%)
25.55%
Quarterly Results Snapshot (Standalone) - Mar'26 - QoQ
QoQ Growth in quarter ended Mar 2026 is 0.00% vs 0.00% in Dec 2025

QoQ Growth in quarter ended Mar 2026 is -33.33% vs 40.00% in Dec 2025
Half Yearly Results Snapshot (Standalone) - Sep'25
Growth in half year ended Sep 2025 is 0.00% vs 0.00% in Sep 2024
Growth in half year ended Sep 2025 is -393.26% vs 8.25% in Sep 2024
Nine Monthly Results Snapshot (Standalone) - Dec'25
YoY Growth in nine months ended Dec 2025 is 0.00% vs 0.00% in Dec 2024
YoY Growth in nine months ended Dec 2025 is -258.46% vs -0.78% in Dec 2024
Annual Results Snapshot (Standalone) - Mar'26
YoY Growth in year ended Mar 2026 is 0.00% vs 0.00% in Mar 2025
YoY Growth in year ended Mar 2026 is -172.83% vs 41.21% in Mar 2025
About Shyam Telecom Ltd

Company Coordinates


